
Volvo S80 Insurance Rates
Enter your zip code below to view companies that have cheap auto insurance rates.
Michelle Robbins
Licensed Insurance Agent
Michelle Robbins has been a licensed insurance agent for over 13 years. Her career began in the real estate industry, supporting local realtors with Title Insurance. After several years, Michelle shifted to real estate home warranty insurance, where she managed a territory of over 100 miles of real estate professionals. Later, Agent Robbins obtained more licensing and experience serving families a...
Licensed Insurance Agent
UPDATED: Apr 28, 2024
It’s all about you. We want to help you make the right coverage choices.
Advertiser Disclosure: We strive to help you make confident car insurance decisions. Comparison shopping should be easy. We are not affiliated with any one car insurance provider and cannot guarantee quotes from any single provider.
Our insurance industry partnerships don’t influence our content. Our opinions are our own. To compare quotes from many different companies please enter your ZIP code on this page to use the free quote tool. The more quotes you compare, the more chances to save.
Editorial Guidelines: We are a free online resource for anyone interested in learning more about auto insurance. Our goal is to be an objective, third-party resource for everything auto insurance related. We update our site regularly, and all content is reviewed by auto insurance experts.
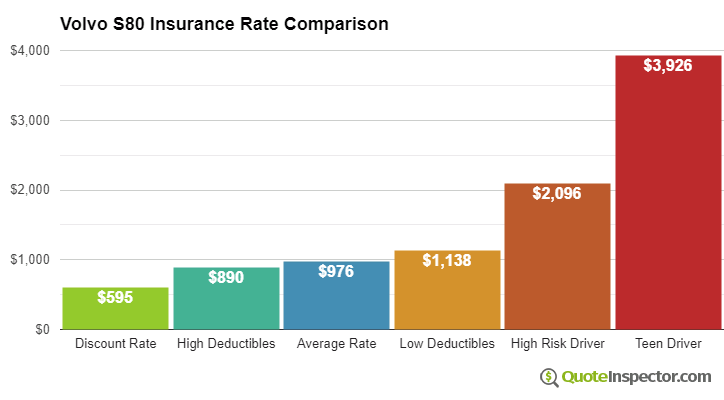
Average insurance rates for a Volvo S80 are $976 a year with full coverage. Comprehensive insurance costs on average $160 a year, collision costs $216, and liability insurance is estimated at $442. Buying just liability costs approximately $496 a year, with insurance for high-risk drivers costing $2,096 or more. Teens receive the highest rates at $3,926 a year or more.
Average premium for full coverage: $976
Rate estimates by individual coverage type:
Estimates include $500 policy deductibles, liability limits of 30/60, and includes uninsured/under-insured motorist coverage. Rates are averaged for all U.S. states and S80 trim levels.
Price Range by Coverage and Risk
For the average driver, prices range go from as low as $496 for your basic liability-only policy to a high of $2,096 for a driver that may need high-risk insurance.
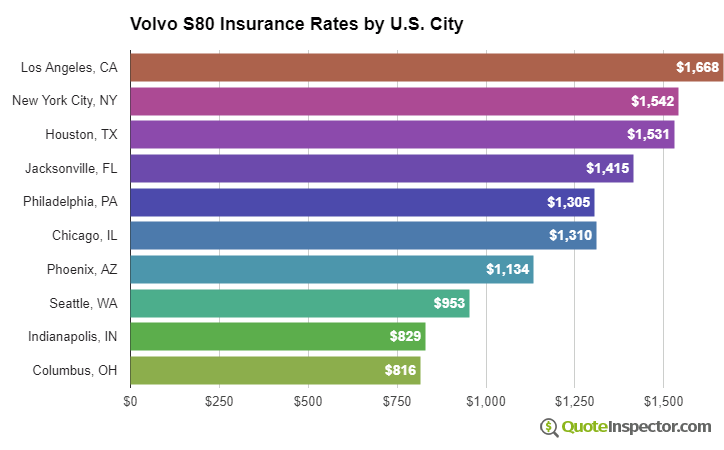
Price Range by Location
Living in a larger city has a significant impact on auto insurance rates. Rural areas tend to have a lower frequency of collision claims than cities with more traffic congestion.
The diagram below illustrates how location impacts car insurance rates.
These examples demonstrate why it is important to get quotes based on a specific location and risk profile, rather than relying on averaged prices.
Use the form below to get customized rates for your location.
Enter your zip code below to view companies based on your location that have cheap auto insurance rates.
More Rate Information
The chart below details estimated Volvo S80 insurance rates for different risk profiles and scenarios.
- The cheapest rate after discounts is $595
- Choosing higher $1,000 deductibles can save around $890 annually
- The average rate for a 40-year-old driver with $500 deductibles is $976
- Selecting low $100 deductibles for comp and collision coverage will cost an extra $162 a year
- High-risk insureds with serious driving violations could pay upwards of $2,096 or more
- The cost for full coverage for a teen driver may cost $3,926 each year
Auto insurance rates for a Volvo S80 can also vary considerably based on your driver profile, the trim level and model year, and policy deductibles and limits.
Older drivers with a good driving record and high deductibles could pay as little as $900 annually on average for full coverage. Rates are much higher for teen drivers, where even good drivers will have to pay upwards of $3,900 a year. View Rates by Age
Where you live plays a big part in determining prices for Volvo S80 insurance rates. A good driver about age 40 could pay as low as $700 a year in states like New Hampshire, Ohio, and Utah, or have to pay at least $1,320 on average in Florida, Michigan, and New York.
| State | Premium | Compared to U.S. Avg | Percent Difference |
|---|---|---|---|
| Alabama | $882 | -$94 | -9.6% |
| Alaska | $748 | -$228 | -23.4% |
| Arizona | $810 | -$166 | -17.0% |
| Arkansas | $976 | -$0 | 0.0% |
| California | $1,112 | $136 | 13.9% |
| Colorado | $934 | -$42 | -4.3% |
| Connecticut | $1,002 | $26 | 2.7% |
| Delaware | $1,106 | $130 | 13.3% |
| Florida | $1,220 | $244 | 25.0% |
| Georgia | $900 | -$76 | -7.8% |
| Hawaii | $702 | -$274 | -28.1% |
| Idaho | $660 | -$316 | -32.4% |
| Illinois | $728 | -$248 | -25.4% |
| Indiana | $734 | -$242 | -24.8% |
| Iowa | $658 | -$318 | -32.6% |
| Kansas | $928 | -$48 | -4.9% |
| Kentucky | $1,332 | $356 | 36.5% |
| Louisiana | $1,446 | $470 | 48.2% |
| Maine | $600 | -$376 | -38.5% |
| Maryland | $806 | -$170 | -17.4% |
| Massachusetts | $782 | -$194 | -19.9% |
| Michigan | $1,696 | $720 | 73.8% |
| Minnesota | $816 | -$160 | -16.4% |
| Mississippi | $1,170 | $194 | 19.9% |
| Missouri | $864 | -$112 | -11.5% |
| Montana | $1,050 | $74 | 7.6% |
| Nebraska | $770 | -$206 | -21.1% |
| Nevada | $1,170 | $194 | 19.9% |
| New Hampshire | $702 | -$274 | -28.1% |
| New Jersey | $1,092 | $116 | 11.9% |
| New Mexico | $864 | -$112 | -11.5% |
| New York | $1,028 | $52 | 5.3% |
| North Carolina | $562 | -$414 | -42.4% |
| North Dakota | $800 | -$176 | -18.0% |
| Ohio | $674 | -$302 | -30.9% |
| Oklahoma | $1,002 | $26 | 2.7% |
| Oregon | $894 | -$82 | -8.4% |
| Pennsylvania | $932 | -$44 | -4.5% |
| Rhode Island | $1,302 | $326 | 33.4% |
| South Carolina | $884 | -$92 | -9.4% |
| South Dakota | $826 | -$150 | -15.4% |
| Tennessee | $856 | -$120 | -12.3% |
| Texas | $1,178 | $202 | 20.7% |
| Utah | $724 | -$252 | -25.8% |
| Vermont | $668 | -$308 | -31.6% |
| Virginia | $584 | -$392 | -40.2% |
| Washington | $756 | -$220 | -22.5% |
| West Virginia | $894 | -$82 | -8.4% |
| Wisconsin | $674 | -$302 | -30.9% |
| Wyoming | $870 | -$106 | -10.9% |
Choosing higher comprehensive and collision insurance deductibles can save as much as $250 each year, while buying higher liability limits will cost you more. Moving from a 50/100 limit to a 250/500 limit will cost as much as $398 extra every year. View Rates by Deductible or Liability Limit
If you like to drive fast or tend to cause accidents, you may be forking out at a minimum $1,200 to $1,600 in extra premium per year, depending on your age. A high-risk auto insurance policy ranges anywhere from 41% to 137% more than the average policy. View High Risk Driver Rates
With so much variability in rates, the best way to find out exactly what you will pay is to get quotes from as many companies as possible. Each auto insurer calculates rates differently, and quoted rates can be significantly different from one company to the next.
Insurance Rates by Trim Level and Model Year
| Model and Trim | Annual Premium | Monthly Premium |
|---|---|---|
| Volvo S80 3.2 | $948 | $79 |
| Volvo S80 T6 AWD | $960 | $80 |
| Volvo S80 Executive AWD | $976 | $81 |
| Volvo S80 V8 AWD | $990 | $83 |
Rates assume 2002 model year, a 40-year-old male driver with no accidents or violations, $500 comprehensive and collision deductibles, minimum liability limits, and uninsured/under-insured motorist coverage included. Rates are for comparison only and are averaged for all 50 U.S. states.
| Model Year | Comprehensive | Collision | Liability | Total Premium |
|---|---|---|---|---|
| 2016 Volvo S80 | $260 | $466 | $460 | $1,344 |
| 2008 Volvo S80 | $184 | $250 | $460 | $1,052 |
| 2007 Volvo S80 | $182 | $238 | $452 | $1,030 |
| 2005 Volvo S80 | $160 | $216 | $442 | $976 |
Rates are averaged for all Volvo S80 models and trim levels. Rates assume a 40-year-old male driver, full coverage with $500 deductibles, and a clean driving record.
How to Find Low Cost Volvo S80 Insurance
Saving money on Volvo S80 insurance takes avoiding accidents and claims, having good credit, eliminating unnecessary coverage, and taking advantage of discounts. Spend time shopping around once a year by quoting rates from direct companies like GEICO and Progressive, and also from local insurance agents.
The points below are a review of the data that was touched on above.
- You may be able to save as much as $110 per year simply by quoting early and online
- Drivers who require increased liability limits will pay approximately $490 every year to raise limits from a minimum limit to 250/500 limits
- Drivers under the age of 20 are charged the highest rates, with premiums as much as $327 per month if they have full coverage
- High-risk drivers who have several accidents or serious violations may be required to pay an average of $1,120 more each year to insure a Volvo S80
Rate Tables and Charts
Rates by Driver Age
| Driver Age | Premium |
|---|---|
| 16 | $3,926 |
| 20 | $2,234 |
| 30 | $994 |
| 40 | $976 |
| 50 | $896 |
| 60 | $876 |
Full coverage, $500 deductibles
Rates by Deductible
| Deductible | Premium |
|---|---|
| $100 | $1,138 |
| $250 | $1,064 |
| $500 | $976 |
| $1,000 | $890 |
Full coverage, driver age 40
Rates by Liability Limit
| Liability Limit | Premium |
|---|---|
| 30/60 | $976 |
| 50/100 | $1,078 |
| 100/300 | $1,189 |
| 250/500 | $1,476 |
| 100 CSL | $1,123 |
| 300 CSL | $1,366 |
| 500 CSL | $1,543 |
Full coverage, driver age 40
Rates for High Risk Drivers
| Age | Premium |
|---|---|
| 16 | $5,524 |
| 20 | $3,556 |
| 30 | $2,114 |
| 40 | $2,096 |
| 50 | $2,004 |
| 60 | $1,986 |
Full coverage, $500 deductibles, two speeding tickets, and one at-fault accident
If a financial responsibility filing is required, the additional charge below may also apply.
Potential Rate Discounts
If you qualify for discounts, you may save the amounts shown below.
| Discount | Savings |
|---|---|
| Multi-policy | $49 |
| Multi-vehicle | $52 |
| Homeowner | $17 |
| 5-yr Accident Free | $59 |
| 5-yr Claim Free | $61 |
| Paid in Full/EFT | $35 |
| Advance Quote | $43 |
| Online Quote | $65 |
| Total Discounts | $381 |
Discounts are estimated and may not be available from every company or in every state.
Compare Rates and Save
Find companies with the cheapest rates in your area

