Toyota Venza Insurance Rates
Enter your zip code below to view companies that have cheap auto insurance rates.
Michelle Robbins
Licensed Insurance Agent
Michelle Robbins has been a licensed insurance agent for over 13 years. Her career began in the real estate industry, supporting local realtors with Title Insurance. After several years, Michelle shifted to real estate home warranty insurance, where she managed a territory of over 100 miles of real estate professionals. Later, Agent Robbins obtained more licensing and experience serving families a...
Licensed Insurance Agent
UPDATED: Apr 20, 2024
It’s all about you. We want to help you make the right coverage choices.
Advertiser Disclosure: We strive to help you make confident car insurance decisions. Comparison shopping should be easy. We are not affiliated with any one car insurance provider and cannot guarantee quotes from any single provider.
Our insurance industry partnerships don’t influence our content. Our opinions are our own. To compare quotes from many different companies please enter your ZIP code on this page to use the free quote tool. The more quotes you compare, the more chances to save.
Editorial Guidelines: We are a free online resource for anyone interested in learning more about auto insurance. Our goal is to be an objective, third-party resource for everything auto insurance related. We update our site regularly, and all content is reviewed by auto insurance experts.
U.S. average auto insurance rates for a Toyota Venza are $1,182 annually for full coverage insurance. Comprehensive insurance costs on average $214, collision costs $350, and liability is estimated at $460. A policy with just liability insurance costs approximately $510 a year, with coverage for high-risk drivers costing $2,554 or more. Teens pay the highest rates at $4,612 a year or more.
Average premium for full coverage: $1,182
Price estimates by individual coverage:
Rates are based on $500 comprehensive and collision deductibles, 30/60 split liability limits, and includes both medical and uninsured motorist insurance. Estimates are averaged for all 50 states and for different Venza trim levels.
Price Range from Low to High
Using a 40-year-old driver as an example, Toyota Venza insurance prices go from as cheap as $510 for minimum levels of liability insurance to a much higher rate of $2,554 for a high-risk insurance policy.
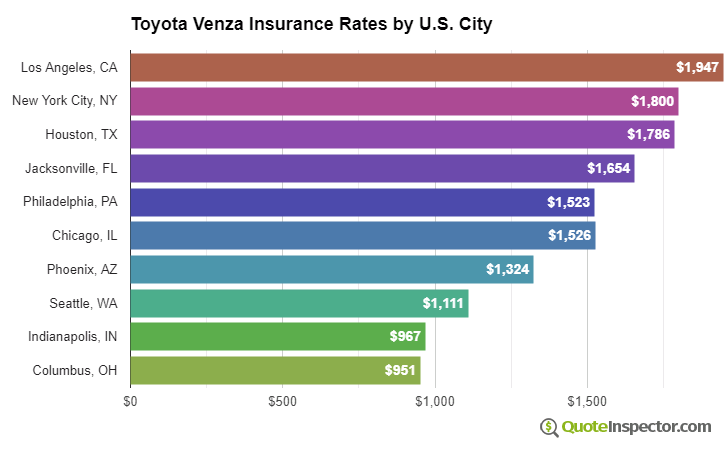
Geographic Price Range
Living in a larger city can make a big difference on insurance rates. Rural areas have fewer physical damage claims than cities with more traffic congestion.
The price range example below illustrates how rural and urban location affects car insurance rates.
The ranges above illustrate why anyone shopping for car insurance should get quotes based on a specific location and their own personal driving habits, instead of making a decision based on averaged prices.
Use the form below to get customized rates for your location.
Enter your zip code below to view companies based on your location that have cheap auto insurance rates.
Additional Rate Details
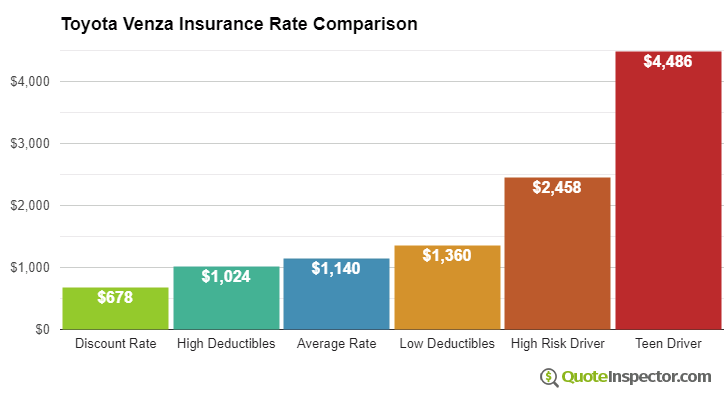
The chart below illustrates estimated Toyota Venza insurance rates for different risk profiles and scenarios.
- The cheapest rate after discounts is $698
- Choosing higher $1,000 deductibles can save around $130 each year
- The estimated rate for the average middle-age driver with $500 deductibles is $1,182
- Selecting more expensive low deductibles for comp and collision coverage costs an additional $246 annually
- Higher-risk drivers with serious driving violations could pay upwards of $2,554 or more
- The price with full coverage for a 16-year-old driver with full coverage may cost $4,612 each year
Insurance prices for a Toyota Venza are also quite variable based on the trim level and model year, your risk profile, and policy deductibles and limits.
An older driver with a clean driving record and high physical damage deductibles may pay as low as $1,100 annually on average for full coverage. Prices are much higher for teenage drivers, where even without any violations or accidents they can expect to pay upwards of $4,600 a year. View Rates by Age
If you have some driving violations or you caused a few accidents, you are probably paying at a minimum $1,400 to $2,000 extra each year, depending on your age. High-risk driver insurance ranges from 43% to 132% more than the average policy. View High Risk Driver Rates
Choosing higher comprehensive and collision insurance deductibles can save as much as $380 annually, while increasing your policy's liability limits will cost you more. Switching from a 50/100 bodily injury limit to a 250/500 limit will increase prices by as much as $414 more per year. View Rates by Deductible or Liability Limit
The state you live in plays a big part in determining prices for Toyota Venza insurance prices. A good driver about age 40 could pay as low as $770 a year in states like Vermont, Wisconsin, and North Carolina, or have to pay at least $1,600 on average in Michigan, New York, and Florida.
| State | Premium | Compared to U.S. Avg | Percent Difference |
|---|---|---|---|
| Alabama | $1,070 | -$112 | -9.5% |
| Alaska | $906 | -$276 | -23.4% |
| Arizona | $982 | -$200 | -16.9% |
| Arkansas | $1,182 | -$0 | 0.0% |
| California | $1,346 | $164 | 13.9% |
| Colorado | $1,130 | -$52 | -4.4% |
| Connecticut | $1,214 | $32 | 2.7% |
| Delaware | $1,336 | $154 | 13.0% |
| Florida | $1,478 | $296 | 25.0% |
| Georgia | $1,090 | -$92 | -7.8% |
| Hawaii | $848 | -$334 | -28.3% |
| Idaho | $800 | -$382 | -32.3% |
| Illinois | $880 | -$302 | -25.5% |
| Indiana | $890 | -$292 | -24.7% |
| Iowa | $796 | -$386 | -32.7% |
| Kansas | $1,124 | -$58 | -4.9% |
| Kentucky | $1,612 | $430 | 36.4% |
| Louisiana | $1,748 | $566 | 47.9% |
| Maine | $730 | -$452 | -38.2% |
| Maryland | $974 | -$208 | -17.6% |
| Massachusetts | $946 | -$236 | -20.0% |
| Michigan | $2,052 | $870 | 73.6% |
| Minnesota | $990 | -$192 | -16.2% |
| Mississippi | $1,414 | $232 | 19.6% |
| Missouri | $1,048 | -$134 | -11.3% |
| Montana | $1,270 | $88 | 7.4% |
| Nebraska | $932 | -$250 | -21.2% |
| Nevada | $1,418 | $236 | 20.0% |
| New Hampshire | $852 | -$330 | -27.9% |
| New Jersey | $1,322 | $140 | 11.8% |
| New Mexico | $1,048 | -$134 | -11.3% |
| New York | $1,246 | $64 | 5.4% |
| North Carolina | $680 | -$502 | -42.5% |
| North Dakota | $968 | -$214 | -18.1% |
| Ohio | $816 | -$366 | -31.0% |
| Oklahoma | $1,214 | $32 | 2.7% |
| Oregon | $1,082 | -$100 | -8.5% |
| Pennsylvania | $1,126 | -$56 | -4.7% |
| Rhode Island | $1,578 | $396 | 33.5% |
| South Carolina | $1,070 | -$112 | -9.5% |
| South Dakota | $996 | -$186 | -15.7% |
| Tennessee | $1,036 | -$146 | -12.4% |
| Texas | $1,424 | $242 | 20.5% |
| Utah | $874 | -$308 | -26.1% |
| Vermont | $808 | -$374 | -31.6% |
| Virginia | $708 | -$474 | -40.1% |
| Washington | $916 | -$266 | -22.5% |
| West Virginia | $1,082 | -$100 | -8.5% |
| Wisconsin | $818 | -$364 | -30.8% |
| Wyoming | $1,052 | -$130 | -11.0% |
Since prices can be so different, the only way to figure out exactly what you will pay is to compare prices from multiple companies. Each auto insurer calculates prices differently, so the prices may be quite different between companies.
Insurance Rates by Trim Level and Model Year
| Model and Trim | Annual Premium | Monthly Premium |
|---|---|---|
| Toyota Venza 2WD 4-Dr | $1,182 | $99 |
| Toyota Venza AWD 4-Dr | $1,182 | $99 |
Rates assume 2017 model year, a 40-year-old male driver with no accidents or violations, $500 comprehensive and collision deductibles, minimum liability limits, and uninsured/under-insured motorist coverage included. Rates are for comparison only and are averaged for all 50 U.S. states.
| Model Year | Comprehensive | Collision | Liability | Total Premium |
|---|---|---|---|---|
| 2024 Toyota Venza | $294 | $536 | $398 | $1,386 |
| 2023 Toyota Venza | $284 | $524 | $416 | $1,382 |
| 2022 Toyota Venza | $274 | $502 | $430 | $1,364 |
| 2021 Toyota Venza | $260 | $484 | $442 | $1,344 |
| 2020 Toyota Venza | $250 | $450 | $452 | $1,310 |
| 2019 Toyota Venza | $240 | $424 | $456 | $1,278 |
| 2018 Toyota Venza | $230 | $380 | $460 | $1,228 |
| 2017 Toyota Venza | $214 | $350 | $460 | $1,182 |
| 2016 Toyota Venza | $206 | $328 | $464 | $1,156 |
| 2013 Toyota Venza | $182 | $258 | $478 | $1,076 |
| 2012 Toyota Venza | $170 | $236 | $474 | $1,038 |
| 2010 Toyota Venza | $154 | $192 | $468 | $972 |
Rates are averaged for all Toyota Venza models and trim levels. Rates assume a 40-year-old male driver, full coverage with $500 deductibles, and a clean driving record.
How to Buy the Best Cheap Toyota Venza Insurance
Getting lower rates on insurance for a Toyota Venza takes avoiding accidents and violations, having a good credit history, not filing small claims, and bundling your home and auto policies. Set aside time to shop around at least every other year by quoting rates from direct insurance companies like GEICO, Progressive, and Esurance, and also from local exclusive and independent agents.
The list below is a quick review of the car insurance concepts raised in the charts and tables above.
- Drivers considered higher risk with a DUI or reckless driving violation may pay on average $1,370 more each year for car insurance
- It is possible to save as much as $140 per year simply by shopping early and online
- Increasing physical damage deductibles could save up to $375 each year
- Insureds who require higher liability limits will pay approximately $510 annually to raise limits from a low limit to higher 250/500 limits
Rate Tables and Charts
Rates by Driver Age
| Driver Age | Premium |
|---|---|
| 16 | $4,612 |
| 20 | $2,720 |
| 30 | $1,216 |
| 40 | $1,182 |
| 50 | $1,082 |
| 60 | $1,060 |
Full coverage, $500 deductibles
Rates by Deductible
| Deductible | Premium |
|---|---|
| $100 | $1,428 |
| $250 | $1,314 |
| $500 | $1,182 |
| $1,000 | $1,052 |
Full coverage, driver age 40
Rates by Liability Limit
| Liability Limit | Premium |
|---|---|
| 30/60 | $1,182 |
| 50/100 | $1,274 |
| 100/300 | $1,389 |
| 250/500 | $1,688 |
| 100 CSL | $1,320 |
| 300 CSL | $1,573 |
| 500 CSL | $1,757 |
Full coverage, driver age 40
Rates for High Risk Drivers
| Age | Premium |
|---|---|
| 16 | $6,536 |
| 20 | $4,334 |
| 30 | $2,594 |
| 40 | $2,554 |
| 50 | $2,442 |
| 60 | $2,420 |
Full coverage, $500 deductibles, two speeding tickets, and one at-fault accident
If a financial responsibility filing is required, the additional charge below may also apply.
Potential Rate Discounts
If you qualify for discounts, you may save the amounts shown below.
| Discount | Savings |
|---|---|
| Multi-policy | $61 |
| Multi-vehicle | $63 |
| Homeowner | $19 |
| 5-yr Accident Free | $80 |
| 5-yr Claim Free | $76 |
| Paid in Full/EFT | $48 |
| Advance Quote | $55 |
| Online Quote | $82 |
| Total Discounts | $484 |
Discounts are estimated and may not be available from every company or in every state.
Compare Rates and Save
Find companies with the cheapest rates in your area