
Ford Flex Insurance Rates
Enter your zip code below to view companies that have cheap auto insurance rates.
Michelle Robbins
Licensed Insurance Agent
Michelle Robbins has been a licensed insurance agent for over 13 years. Her career began in the real estate industry, supporting local realtors with Title Insurance. After several years, Michelle shifted to real estate home warranty insurance, where she managed a territory of over 100 miles of real estate professionals. Later, Agent Robbins obtained more licensing and experience serving families a...
Licensed Insurance Agent
UPDATED: May 31, 2024
It’s all about you. We want to help you make the right coverage choices.
Advertiser Disclosure: We strive to help you make confident car insurance decisions. Comparison shopping should be easy. We are not affiliated with any one car insurance provider and cannot guarantee quotes from any single provider.
Our insurance industry partnerships don’t influence our content. Our opinions are our own. To compare quotes from many different companies please enter your ZIP code on this page to use the free quote tool. The more quotes you compare, the more chances to save.
Editorial Guidelines: We are a free online resource for anyone interested in learning more about auto insurance. Our goal is to be an objective, third-party resource for everything auto insurance related. We update our site regularly, and all content is reviewed by auto insurance experts.
How much is a Ford Flex to insure in comparison to other vehicles? Average Ford Flex insurance rates are $1,464 a year, or $122 a month. To learn more about Ford Flex car insurance rates and how to save on Ford Flex costs, read on.
Use our free rate comparison tool above to find out which insurance company has the cheapest rates for a Ford Flex.
U.S. average insurance rates for a Ford Flex are $1,114 a year including full coverage. Comprehensive insurance costs approximately $206, collision insurance costs $272, and liability insurance is estimated at $478. Buying just liability costs approximately $526 a year, and insurance for high-risk drivers costs $2,392 or more. Teen drivers pay the highest rates at up to $4,378 a year.
Average premium for full coverage: $1,114
Price estimates by individual coverage:
Includes $500 physical damage insurance deductibles, split liability limits of 30/60, and includes UM/UIM and medical coverage. Estimates are averaged for all 50 U.S. states and for all Flex models.
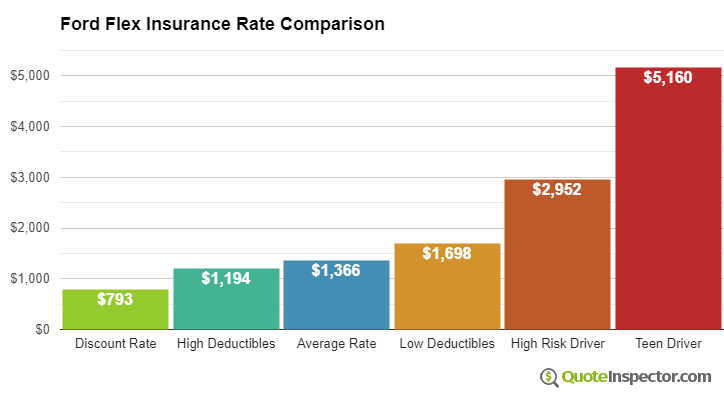
Price Range from Low to High
For a driver around age 40, Ford Flex insurance prices range from the low end price of $526 for a discount liability-only rate to the much higher price of $2,392 for coverage for higher-risk drivers.
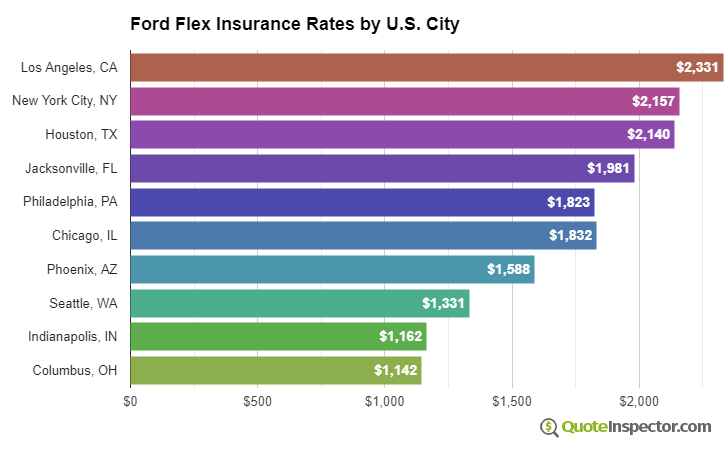
Geographic Price Range
Living in a larger city has a significant impact on car insurance prices. Rural locations have lower incidents of comprehensive and collision claims than larger metro areas. The example below illustrates the difference between rural and urban areas on auto insurance prices.
The ranges above highlight why everyone should get quotes using their specific location, rather than relying on price averages.
Use the form below to get customized rates for your location.
Enter your zip code below to view companies based on your location that have cheap auto insurance rates.
Rates by State, City, and Model
The chart below breaks down average Ford Flex insurance rates for additional coverage and risk scenarios.
- The lowest rate with discounts is $671
- Choosing higher $1,000 deductibles can save $110 every year
- The estimated price for the average middle-age driver who chooses $500 deductibles is $1,114
- Choosing pricier low deductibles for comp and collision coverage will cost an additional $206 a year
- High-risk insureds with multiple violations and an at-fault accident could pay around $2,392
- The price that insures a teen driver for full coverage can cost $4,378 each year
Insurance prices for a Ford Flex are also quite variable based on the model of your Flex, your driving record and age, and physical damage deductibles and liability limits.
If you have some driving violations or you caused an accident, you are likely paying anywhere from $1,300 to $1,900 additional each year, depending on your age. Ford Flex insurance for high-risk drivers ranges anywhere from 43% to 130% more than average. View High Risk Driver Rates
A more mature driver with no violations or accidents and higher comprehensive and collision deductibles could pay as little as $1,000 annually on average for full coverage. Prices are highest for teenage drivers, since even teens with perfect driving records should be prepared to pay in the ballpark of $4,300 a year. View Rates by Age
The state you live in plays a big part in determining prices for Ford Flex insurance rates. A good driver about age 40 could pay as low as $860 a year in states like Vermont, New Hampshire, and Missouri, or as much as $1,590 on average in Louisiana, New York, and Michigan.
| State | Premium | Compared to U.S. Avg | Percent Difference |
|---|---|---|---|
| Alabama | $1,008 | -$106 | -9.5% |
| Alaska | $854 | -$260 | -23.3% |
| Arizona | $924 | -$190 | -17.1% |
| Arkansas | $1,114 | -$0 | 0.0% |
| California | $1,268 | $154 | 13.8% |
| Colorado | $1,064 | -$50 | -4.5% |
| Connecticut | $1,144 | $30 | 2.7% |
| Delaware | $1,260 | $146 | 13.1% |
| Florida | $1,392 | $278 | 25.0% |
| Georgia | $1,026 | -$88 | -7.9% |
| Hawaii | $800 | -$314 | -28.2% |
| Idaho | $754 | -$360 | -32.3% |
| Illinois | $828 | -$286 | -25.7% |
| Indiana | $836 | -$278 | -25.0% |
| Iowa | $750 | -$364 | -32.7% |
| Kansas | $1,058 | -$56 | -5.0% |
| Kentucky | $1,518 | $404 | 36.3% |
| Louisiana | $1,646 | $532 | 47.8% |
| Maine | $686 | -$428 | -38.4% |
| Maryland | $918 | -$196 | -17.6% |
| Massachusetts | $892 | -$222 | -19.9% |
| Michigan | $1,934 | $820 | 73.6% |
| Minnesota | $932 | -$182 | -16.3% |
| Mississippi | $1,334 | $220 | 19.7% |
| Missouri | $988 | -$126 | -11.3% |
| Montana | $1,196 | $82 | 7.4% |
| Nebraska | $878 | -$236 | -21.2% |
| Nevada | $1,334 | $220 | 19.7% |
| New Hampshire | $802 | -$312 | -28.0% |
| New Jersey | $1,246 | $132 | 11.8% |
| New Mexico | $984 | -$130 | -11.7% |
| New York | $1,172 | $58 | 5.2% |
| North Carolina | $640 | -$474 | -42.5% |
| North Dakota | $910 | -$204 | -18.3% |
| Ohio | $770 | -$344 | -30.9% |
| Oklahoma | $1,142 | $28 | 2.5% |
| Oregon | $1,018 | -$96 | -8.6% |
| Pennsylvania | $1,064 | -$50 | -4.5% |
| Rhode Island | $1,484 | $370 | 33.2% |
| South Carolina | $1,008 | -$106 | -9.5% |
| South Dakota | $940 | -$174 | -15.6% |
| Tennessee | $976 | -$138 | -12.4% |
| Texas | $1,344 | $230 | 20.6% |
| Utah | $826 | -$288 | -25.9% |
| Vermont | $762 | -$352 | -31.6% |
| Virginia | $666 | -$448 | -40.2% |
| Washington | $860 | -$254 | -22.8% |
| West Virginia | $1,020 | -$94 | -8.4% |
| Wisconsin | $770 | -$344 | -30.9% |
| Wyoming | $992 | -$122 | -11.0% |
Choosing high deductibles can save as much as $320 each year, whereas buying more liability protection will push prices upward. Changing from a 50/100 bodily injury protection limit to a 250/500 limit will increase prices by as much as $430 more each year. View Rates by Deductible or Liability Limit
Insurance Rates by Trim Level and Model Year
| Model and Trim | Annual Premium | Monthly Premium |
|---|---|---|
| Ford Flex SE 2WD | $1,070 | $89 |
| Ford Flex SEL 2WD | $1,092 | $91 |
| Ford Flex SEL AWD | $1,114 | $93 |
| Ford Flex Limited 2WD | $1,134 | $95 |
| Ford Flex Limited AWD | $1,134 | $95 |
Rates assume 2013 model year, a 40-year-old male driver with no accidents or violations, $500 comprehensive and collision deductibles, minimum liability limits, and uninsured/under-insured motorist coverage included. Rates are for comparison only and are averaged for all 50 U.S. states.
| Model Year | Comprehensive | Collision | Liability | Total Premium |
|---|---|---|---|---|
| 2019 Ford Flex | $270 | $446 | $456 | $1,330 |
| 2018 Ford Flex | $258 | $400 | $460 | $1,276 |
| 2017 Ford Flex | $242 | $368 | $460 | $1,228 |
| 2016 Ford Flex | $234 | $346 | $464 | $1,202 |
| 2015 Ford Flex | $228 | $322 | $474 | $1,182 |
| 2014 Ford Flex | $210 | $300 | $474 | $1,142 |
| 2013 Ford Flex | $206 | $272 | $478 | $1,114 |
| 2012 Ford Flex | $192 | $248 | $474 | $1,072 |
| 2011 Ford Flex | $180 | $226 | $474 | $1,038 |
| 2010 Ford Flex | $174 | $202 | $468 | $1,002 |
Rates are averaged for all Ford Flex models and trim levels. Rates assume a 40-year-old male driver, full coverage with $500 deductibles, and a clean driving record.
How to Find the Cheapest Ford Flex Insurance
Getting lower rates on Ford Flex insurance takes being a low-risk driver, having a good credit score, being claim-free, and consideration of higher deductibles. Shop around at least once a year by getting rate quotes from direct car insurance companies, and also from local auto insurance providers.
The items below are a recap of the primary concepts that were covered above.
- You may be able to save around $130 per year just by quoting online well ahead of the renewal date
- High-risk drivers that have major violations or accidents will likely pay on average $1,280 more per year to insure their Flex
- Increasing physical damage deductibles can save approximately $325 each year
- Teen drivers are the costliest to insure, possibly costing $365 a month if comprehensive and collision insurance is included
Comparing rates is the best way to save on Ford Flex insurance rates, whether you are shopping for 2020 or 2013 Ford Flex costs. Use our free rate comparison tool below to find the best Ford Flex insurance rates in your area.
Free Car Insurance Comparison
Compare Quotes From Top Companies and Save


What are the safety ratings of the Ford Flex?
Is the Ford Flex a reliable car? If the Ford Flex safety ratings and features are good, insurers will usually offer you cheaper rates. Some of the standard safety features in the Ford Flex include a rearview camera, rear parking sensors, and MyKey (sets speed and audio volume limits).
The Insurance Institute for Highway Safety (IIHS) has rated the Ford Flex in multiple crash tests, which you can see below.
- Small overlap front (driver-side): Acceptable
- Moderate overlap front: Good
- Side: Good
- Roof strength: Good
- Head restraints and seats: Good
View the video below for an example of the IIHS’s crash testing on the Ford Flex.
Ford Flex Compared Against Other Vehicles in the Same Class
The Ford Flex is a midsize SUV. According to the IIHS, the Ford Flex has average liability insurance losses in comparison to other midsize SUVs. This means the Ford Flex’s liability rates will be normal for its class.
Take a look at the midsize SUVs below to see how their rates compare to the Ford Flex’s rates.
Ready to start saving on insurance rates for your Ford Flex today? Enter your ZIP code in our free tool.
References
Rate Tables and Charts
Rates by Driver Age
| Driver Age | Premium |
|---|---|
| 16 | $4,378 |
| 20 | $2,534 |
| 30 | $1,140 |
| 40 | $1,114 |
| 50 | $1,022 |
| 60 | $998 |
Full coverage, $500 deductibles
Rates by Deductible
| Deductible | Premium |
|---|---|
| $100 | $1,320 |
| $250 | $1,224 |
| $500 | $1,114 |
| $1,000 | $1,004 |
Full coverage, driver age 40
Rates by Liability Limit
| Liability Limit | Premium |
|---|---|
| 30/60 | $1,114 |
| 50/100 | $1,230 |
| 100/300 | $1,349 |
| 250/500 | $1,660 |
| 100 CSL | $1,277 |
| 300 CSL | $1,540 |
| 500 CSL | $1,732 |
Full coverage, driver age 40
Rates for High Risk Drivers
| Age | Premium |
|---|---|
| 16 | $6,188 |
| 20 | $4,040 |
| 30 | $2,420 |
| 40 | $2,392 |
| 50 | $2,286 |
| 60 | $2,262 |
Full coverage, $500 deductibles, two speeding tickets, and one at-fault accident
If a financial responsibility filing is required, the additional charge below may also apply.
Potential Rate Discounts
If you qualify for discounts, you may save the amounts shown below.
| Discount | Savings |
|---|---|
| Multi-policy | $57 |
| Multi-vehicle | $59 |
| Homeowner | $19 |
| 5-yr Accident Free | $70 |
| 5-yr Claim Free | $70 |
| Paid in Full/EFT | $42 |
| Advance Quote | $50 |
| Online Quote | $76 |
| Total Discounts | $443 |
Discounts are estimated and may not be available from every company or in every state.
Compare Rates and Save
Find companies with the cheapest rates in your area

