
Chevrolet Spark Insurance Rates
Enter your zip code below to view companies that have cheap auto insurance rates.
Michelle Robbins
Licensed Insurance Agent
Michelle Robbins has been a licensed insurance agent for over 13 years. Her career began in the real estate industry, supporting local realtors with Title Insurance. After several years, Michelle shifted to real estate home warranty insurance, where she managed a territory of over 100 miles of real estate professionals. Later, Agent Robbins obtained more licensing and experience serving families a...
Licensed Insurance Agent
UPDATED: May 16, 2024
It’s all about you. We want to help you make the right coverage choices.
Advertiser Disclosure: We strive to help you make confident car insurance decisions. Comparison shopping should be easy. We are not affiliated with any one car insurance provider and cannot guarantee quotes from any single provider.
Our insurance industry partnerships don’t influence our content. Our opinions are our own. To compare quotes from many different companies please enter your ZIP code on this page to use the free quote tool. The more quotes you compare, the more chances to save.
Editorial Guidelines: We are a free online resource for anyone interested in learning more about auto insurance. Our goal is to be an objective, third-party resource for everything auto insurance related. We update our site regularly, and all content is reviewed by auto insurance experts.
Average insurance rates for a Chevrolet Spark are $1,234 a year with full coverage. Comprehensive insurance costs approximately $188 each year, collision costs $352, and liability is $514. Buying just liability costs around $572 a year, with insurance for high-risk drivers costing $2,686 or more. 16-year-old drivers receive the highest rates at $4,944 a year or more.
Average premium for full coverage: $1,234
Rate estimates by individual coverage type:
Rate estimates include $500 policy deductibles, 30/60 bodily injury liability limits, and includes UM/UIM and medical coverage. Rates are averaged for all U.S. states and Spark models.
Price Range by Coverage and Risk
For a driver around age 40, prices range go from the low end price of $572 for a discount liability-only rate to a high rate of $2,686 for a driver who requires high-risk insurance.
Price Range by Location
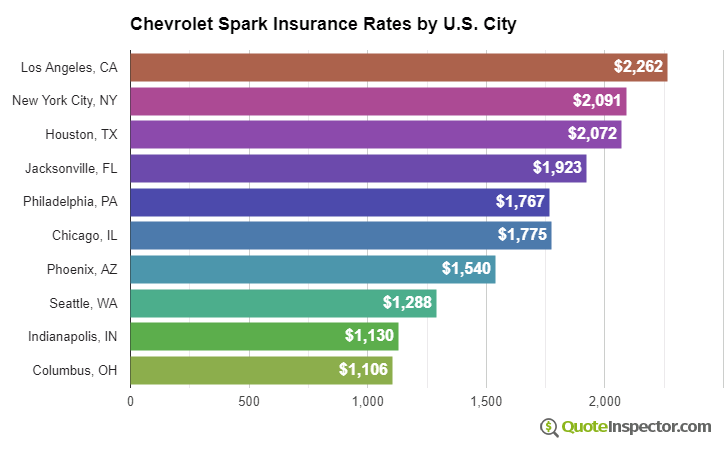
Choosing to live in a large city can make a big difference on the price of insurance. Rural locations tend to have lower incidents of collision claims than congested cities.
The graphic below illustrates the difference between rural and urban areas on auto insurance prices.
These examples demonstrate why all drivers should compare rates quotes using their specific location, instead of making a decision based on rate averages.
Use the form below to get customized rates for your location.
Enter your zip code below to view companies based on your location that have cheap auto insurance rates.
Rates by State, City, and Model
The chart below details estimated Chevrolet Spark insurance rates for additional coverage and risk scenarios.
- The best full coverage rate is $730
- Raising to $1,000 deductibles will save $120 annually
- The estimated price for a 40-year-old driver who chooses $500 deductibles is $1,234
- Buying low deductibles will cost an additional $240 annually
- Drivers with multiple tickets or accidents could pay around $2,686 or more
- The cost that insures a 16-year-old driver can cost $4,944
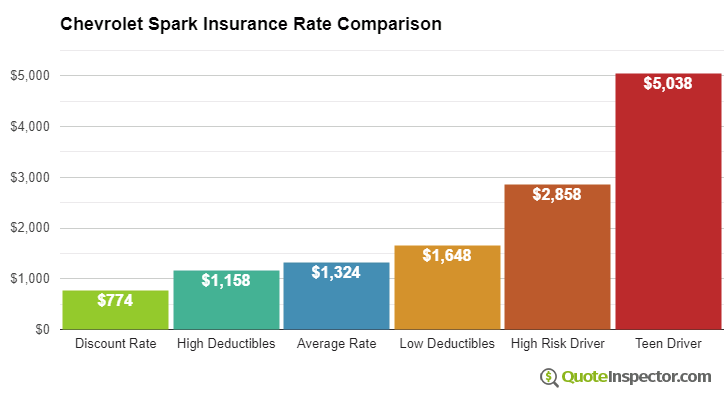
Auto insurance rates for a Chevrolet Spark can also vary considerably based on the trim level and model year, your age and driving habits, and physical damage deductibles and liability limits.
If you like to drive fast or you caused an accident, you may be forking out anywhere from $1,500 to $2,100 in extra premium per year, depending on your age. Insurance for high-risk drivers is expensive and can cost from 42% to 135% more than the average rate. View High Risk Driver Rates
More mature drivers with a good driving record and higher comprehensive and collision deductibles may pay as low as $1,200 every 12 months on average for full coverage. Rates are highest for teen drivers, since even teens with perfect driving records will have to pay in the ballpark of $4,900 a year. View Rates by Age
Where you live also has a big influence on Chevrolet Spark insurance prices. A middle-age driver might find rates as low as $890 a year in states like Utah, Ohio, and New Hampshire, or at least $1,670 on average in New York, Michigan, and Florida.
| State | Premium | Compared to U.S. Avg | Percent Difference |
|---|---|---|---|
| Alabama | $1,116 | -$118 | -9.6% |
| Alaska | $946 | -$288 | -23.3% |
| Arizona | $1,026 | -$208 | -16.9% |
| Arkansas | $1,234 | -$0 | 0.0% |
| California | $1,406 | $172 | 13.9% |
| Colorado | $1,180 | -$54 | -4.4% |
| Connecticut | $1,268 | $34 | 2.8% |
| Delaware | $1,400 | $166 | 13.5% |
| Florida | $1,548 | $314 | 25.4% |
| Georgia | $1,142 | -$92 | -7.5% |
| Hawaii | $888 | -$346 | -28.0% |
| Idaho | $838 | -$396 | -32.1% |
| Illinois | $920 | -$314 | -25.4% |
| Indiana | $932 | -$302 | -24.5% |
| Iowa | $834 | -$400 | -32.4% |
| Kansas | $1,172 | -$62 | -5.0% |
| Kentucky | $1,684 | $450 | 36.5% |
| Louisiana | $1,828 | $594 | 48.1% |
| Maine | $764 | -$470 | -38.1% |
| Maryland | $1,020 | -$214 | -17.3% |
| Massachusetts | $986 | -$248 | -20.1% |
| Michigan | $2,144 | $910 | 73.7% |
| Minnesota | $1,034 | -$200 | -16.2% |
| Mississippi | $1,480 | $246 | 19.9% |
| Missouri | $1,096 | -$138 | -11.2% |
| Montana | $1,328 | $94 | 7.6% |
| Nebraska | $974 | -$260 | -21.1% |
| Nevada | $1,484 | $250 | 20.3% |
| New Hampshire | $890 | -$344 | -27.9% |
| New Jersey | $1,382 | $148 | 12.0% |
| New Mexico | $1,092 | -$142 | -11.5% |
| New York | $1,302 | $68 | 5.5% |
| North Carolina | $712 | -$522 | -42.3% |
| North Dakota | $1,012 | -$222 | -18.0% |
| Ohio | $854 | -$380 | -30.8% |
| Oklahoma | $1,268 | $34 | 2.8% |
| Oregon | $1,132 | -$102 | -8.3% |
| Pennsylvania | $1,176 | -$58 | -4.7% |
| Rhode Island | $1,648 | $414 | 33.5% |
| South Carolina | $1,120 | -$114 | -9.2% |
| South Dakota | $1,042 | -$192 | -15.6% |
| Tennessee | $1,078 | -$156 | -12.6% |
| Texas | $1,488 | $254 | 20.6% |
| Utah | $914 | -$320 | -25.9% |
| Vermont | $846 | -$388 | -31.4% |
| Virginia | $738 | -$496 | -40.2% |
| Washington | $954 | -$280 | -22.7% |
| West Virginia | $1,132 | -$102 | -8.3% |
| Wisconsin | $854 | -$380 | -30.8% |
| Wyoming | $1,100 | -$134 | -10.9% |
Opting for high physical damage deductibles can reduce rates by up to $360 annually, whereas increasing liability limits will push rates upward. Moving from a 50/100 bodily injury protection limit to a 250/500 limit will cost as much as $462 extra every year. View Rates by Deductible or Liability Limit
With so much variability in rates, the best way to find out who has the cheapest auto insurance rates is to do a rate comparison from multiple companies. Every auto insurance company utilizes a different rate formula, and quoted rates can be significantly different.
| Model Year | Comprehensive | Collision | Liability | Total Premium |
|---|---|---|---|---|
| 2022 Chevrolet Spark | $216 | $418 | $486 | $1,300 |
| 2021 Chevrolet Spark | $204 | $404 | $500 | $1,288 |
| 2020 Chevrolet Spark | $196 | $374 | $510 | $1,260 |
| 2019 Chevrolet Spark | $188 | $352 | $514 | $1,234 |
| 2018 Chevrolet Spark | $180 | $316 | $520 | $1,196 |
| 2017 Chevrolet Spark | $168 | $292 | $520 | $1,160 |
| 2015 Chevrolet Spark | $158 | $254 | $534 | $1,126 |
| 2014 Chevrolet Spark | $148 | $236 | $534 | $1,098 |
| 2013 Chevrolet Spark | $144 | $214 | $540 | $1,078 |
Rates are averaged for all Chevrolet Spark models and trim levels. Rates assume a 40-year-old male driver, full coverage with $500 deductibles, and a clean driving record.
How to Find the Best Chevrolet Spark Insurance
Saving money on insurance for a Chevrolet Spark consists of being safe and accident-free, maintaining a good credit score, eliminating unnecessary coverage, and not having any coverage lapses. Comparison shop at every other renewal by requesting quotes from direct companies like Progressive, GEICO, and Esurance, and also from local insurance agencies.
Below you'll find a brief recap of the concepts that were covered above.
- Drivers considered higher risk who tend to receive serious violations may have to pay on average $1,450 more per year than a low-risk driver
- Youthful drivers have the highest car insurance rates, with premiums as much as $412 per month if the policy includes full coverage
- You may be able to save around $140 per year simply by quoting online in advance
- Increasing deductibles can save approximately $350 each year
- You may be able to save around $140 per year simply by quoting online in advance
Rate Tables and Charts
Rates by Driver Age
| Driver Age | Premium |
|---|---|
| 16 | $4,944 |
| 20 | $2,870 |
| 30 | $1,266 |
| 40 | $1,234 |
| 50 | $1,136 |
| 60 | $1,114 |
Full coverage, $500 deductibles
Rates by Deductible
| Deductible | Premium |
|---|---|
| $100 | $1,474 |
| $250 | $1,364 |
| $500 | $1,234 |
| $1,000 | $1,114 |
Full coverage, driver age 40
Rates by Liability Limit
| Liability Limit | Premium |
|---|---|
| 30/60 | $1,234 |
| 50/100 | $1,337 |
| 100/300 | $1,465 |
| 250/500 | $1,799 |
| 100 CSL | $1,388 |
| 300 CSL | $1,671 |
| 500 CSL | $1,877 |
Full coverage, driver age 40
Rates for High Risk Drivers
| Age | Premium |
|---|---|
| 16 | $6,996 |
| 20 | $4,582 |
| 30 | $2,716 |
| 40 | $2,686 |
| 50 | $2,568 |
| 60 | $2,546 |
Full coverage, $500 deductibles, two speeding tickets, and one at-fault accident
If a financial responsibility filing is required, the additional charge below may also apply.
Potential Rate Discounts
If you qualify for discounts, you may save the amounts shown below.
| Discount | Savings |
|---|---|
| Multi-policy | $63 |
| Multi-vehicle | $68 |
| Homeowner | $21 |
| 5-yr Accident Free | $82 |
| 5-yr Claim Free | $79 |
| Paid in Full/EFT | $49 |
| Advance Quote | $58 |
| Online Quote | $84 |
| Total Discounts | $504 |
Discounts are estimated and may not be available from every company or in every state.
Compare Rates and Save
Find companies with the cheapest rates in your area