Best and Worst Vehicles for Overall Collision Losses in 2026
Enter your Car Insurance Coverage FAQs zip code below to view companies that have cheap auto insurance rates.
Michelle Robbins
Licensed Insurance Agent
Michelle Robbins has been a licensed insurance agent for over 13 years. Her career began in the real estate industry, supporting local realtors with Title Insurance. After several years, Michelle shifted to real estate home warranty insurance, where she managed a territory of over 100 miles of real estate professionals. Later, Agent Robbins obtained more licensing and experience serving families a...
Licensed Insurance Agent
UPDATED: Jul 8, 2023
It’s all about you. We want to help you make the right coverage choices.
Advertiser Disclosure: We strive to help you make confident car insurance decisions. Comparison shopping should be easy. We are not affiliated with any one car insurance provider and cannot guarantee quotes from any single provider.
Our insurance industry partnerships don’t influence our content. Our opinions are our own. To compare quotes from many different companies please enter your ZIP code on this page to use the free quote tool. The more quotes you compare, the more chances to save.
Editorial Guidelines: We are a free online resource for anyone interested in learning more about auto insurance. Our goal is to be an objective, third-party resource for everything auto insurance related. We update our site regularly, and all content is reviewed by auto insurance experts.
Ever wonder why different vehicles get charged different rates for car insurance? Wouldn’t it be easier to just charge the same rate for every vehicle? From a consumer standpoint, that sounds like a great idea and would help eliminate some of the guesswork at how much car insurance would cost.
But realistically, the result would be drivers of safer or lower-cost vehicles would have to subsidize the cost of insurance for more claim-prone or expensive vehicles.
Every vehicle has a specific “fingerprint” when it comes to likelihood of having claims for each type of coverage like comprehensive, collision, medical, bodily injury liability, or property damage liability. The Insurance Services Office, or ISO, which is a subsidiary of Verisk Analytics, specializes in analyzing this data and creating vehicle symbols that insurance companies use to determine rates.
Symbols are broken down by coverage type, so every vehicle has a different symbol for comprehensive, collision, and liability insurance. The symbols help companies predict claims and charge an adequate amount to cover the increased or decreased likelihood of claims being paid out for each coverage.
The Insurance Institute for Highway Safety (specifically the Highway Loss Data Institute) specializes in assembling collision loss information in a way that consumers can find which vehicles are more likely to have certain types of insurance claims.
Vehicle Ratings for Collision Losses
The tables below show the ten vehicles in each model year category that rank the best and worst for collision losses. An average loss rating is 100, so anything lower than that is considered favorable, and any rating higher than 100 is considered to be at higher risk of having more frequent or more costly collision claims.
| Vehicle Make and Model | Overall Collision Loss Rating |
|---|---|
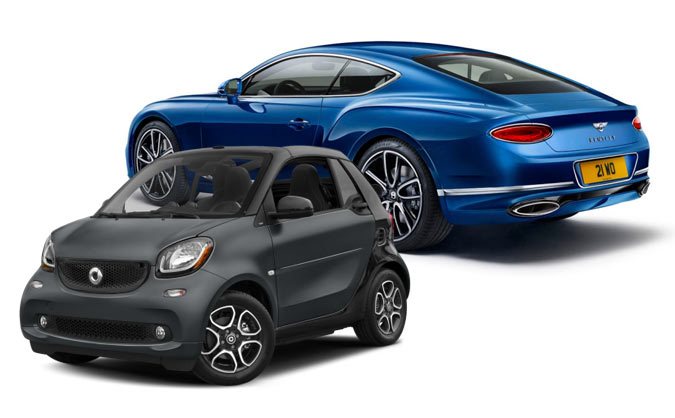
| Smart ForTwo electric | 42 |
| Ram 1500 LWB 4WD | 47 |
| Ford F-250 4WD | 48 |
| Kia Soul electric | 48 |
| Chevrolet Corvette Z06 convertible | 52 |
| Jeep Wrangler 2dr SWB 4WD | 53 |
| Ram 2500 crew cab SWB 2WD | 55 |
| GMC Canyon ext. cab 2WD | 57 |
| Ford F-350 SuperCab 4WD | 57 |
| Subaru Outback 4WD | 57 |
The vehicles with the best collision ratings tend to be pickup and semi trucks, with the exception of the Kia and Smart electric sub-compacts, the Corvette, the Jeep Wrangler, and the Subaru Outback.
Free Auto Insurance Comparison
Enter your zip code below to view companies that have cheap auto insurance rates.


Now let’s take a look at which vehicles have the worst collision ratings based on the IIHS scores.
| Vehicle Make and Model | Overall Collision Loss Rating |
|---|---|
| Bentley Continental GT 2dr 4WD | 650 |
| Bentley Continental Flying Spur 4dr 4WD | 600 |
| Bentley Continental GTC convertible 4WD | 493 |
| BMW i8 plug-in hybrid 2dr 4WD | 425 |
| Maserati Granturismo 2dr | 410 |
| BMW M6 2dr | 384 |
| Audi RS7 4dr 4WD | 359 |
| BMW M3 4dr | 348 |
| BMW M4 2dr | 346 |
| Maserati Ghibli 4dr 4WD | 343 |
Wow, look at those numbers! The top three vehicles with the worst collision losses are all Bentleys, and are over ten times higher than the vehicles with the best collision losses.
Case Studies: Best and Worst Vehicles for Overall Collision Losses
Case Study 5: John’s Journey to Safer Driving
John, a responsible driver, recently switched to a new car model known for its advanced safety features. After analyzing his collision losses for the past year, John discovered a significant decrease compared to his previous vehicle. Lane-keeping assist and blind-spot monitoring in his new car prevented accidents and reduced collision claims.
Case Study 6: Sarah’s Costly Collision Claims
Sarah, an enthusiastic driver, owned a sports car renowned for its high-performance capabilities. However, her vehicle’s collision losses were significantly higher than average. Despite her love for speed and thrill, Sarah’s driving style combined with the car’s lack of advanced safety features led to frequent accidents and substantial insurance claims.
Case Study 7: Mark’s Hybrid Success Story
Mark, an environmentally conscious driver, opted for a hybrid vehicle with excellent fuel efficiency. To his delight, Mark discovered that his car not only helped reduce carbon emissions but also showcased remarkable safety performance. Mark’s hybrid vehicle, with automatic emergency braking and adaptive cruise control.
What do the Numbers Mean?
These numbers are not safety ratings or anything like it. Remember we are talking about collision losses, and collision insurance pays for damages to your vehicle caused by rollover or impact with another object or vehicle. Safety ratings primarily determine the extent of injuries that may be sustained by a vehicle’s occupants in a variety of accident scenarios.
A low number on this rating means one of two things. Either the vehicle model does not have a high frequency of losses, meaning it just doesn’t crash into things or rollover very much, or it does not have a high severity of collision losses, which means when a collision loss does happen, it’s not that expensive to repair.
Conversely, a high rating number means the vehicle costs a lot to repair or has a tendency to have a lot of collision claims. By looking at the types of vehicles in the list of worst collision losses, it’s most likely due to the high cost of repairing the vehicles after a collision.
For example, in the list of the best collision losses, the Jeep Wrangler has been on the top ten list for many years. When a Jeep Wrangler gets damaged, it’s easy for body shops to repair the damage because the panels are easy to repair or replace and vehicle components are easily accessible. Wranglers don’t generally have all the fancy bells and whistles like many other vehicles do, as they are designed to be taken off-road.
On the other hand, the Bentleys, Maseratis, and high-end BMW models have very high repair costs due to the advanced safety and electronics built into the vehicles, and also the specialized parts, finish techniques, and trim materials. A lot of repair shops cannot even repair those types of vehicles, and they have to be transported to a shop that specializes in repairing exotic vehicles.
Collision Loss Ratings for Other Vehicles
Now that we’ve established the best and worst vehicles for collision losses, lets take a look at other popular vehicles and see how they stack up.
| Vehicle Make and Model | Overall Collision Loss Rating |
|---|---|
| Fiat 500 | 76 |
| Mini Cooper | 86 |
| Honda Civic 2-Dr | 120 |
| Honda CR-Z hybrid | 114 |
| Kia Forte | 113 |
| Volkswagen Golf | 99 |
| Honda Accord 2-Dr | 114 |
| Dodge Challenger | 161 |
| Kia Rio | 106 |
| Chevrolet Spark | 79 |
| Chevrolet Cruze | 86 |
| Chevrolet Volt | 88 |
| Nissan Sentra 4-Dr | 121 |
| Toyota Corolla 4-Dr | 124 |
| Toyota Prius Hybrid | 105 |
| Buick Verano | 92 |
| Ford Fusion 4WD | 112 |
| Hyundai Sonata Hybrid | 144 |
| Kia Optima Hybrid | 152 |
| Nissan Altima | 113 |
| Toyota Camry | 107 |
| Volkswagen Jetta | 112 |
| Buick LaCrosse 2WD | 105 |
| Chevrolet SS | 120 |
| Toyota Avalon Hybrid | 124 |
| Audi A5 2dr 4WD | 190 |
| BMW 3 series 4dr 2WD | 131 |
| Cadillac ATS 2dr 2WD | 121 |
| Infiniti Q50 4dr 4WD | 157 |
| Lexus IS 200T 4dr | 200 |
| Lexus IS 350 4dr 4WD | 177 |
| Mercedes-Benz C class AMG 4dr 4WD | 212 |
| Volvo S60 4dr 4WD | 114 |
| BMW 6 series 2dr 4WD | 288 |
| Cadillac CTS 4dr 4WD | 129 |
| Jaguar XJ 4dr LWB 4WD | 240 |
| Lexus RC-F 2dr | 267 |
| Tesla Model S 4dr electric 2WD | 315 |
| Lexus LS 460 4dr 4WD | 206 |
| Lincoln MKS 4dr 2WD | 124 |
| Volvo V60 Cross Country 4WD | 116 |
| Chrysler Town & Country | 82 |
| Dodge Grand Caravan | 81 |
| Honda Odyssey | 76 |
| Nissan Quest | 98 |
| Toyota Sienna 2WD | 103 |
| Chevrolet Colorado crew cab 4WD | 82 |
| GMC Canyon crew cab 4WD | 66 |
| Nissan Frontier crew cab SWB 2WD | 78 |
| Toyota Tacoma double cab 4WD | 102 |
| Chevrolet Silverado 1500 ext. cab 2WD | 92 |
| Ford F-150 SuperCrew 4WD | 76 |
| Ram 1500 crew cab SWB 4WD | 93 |
| GMC Sierra 1500 crew cab 4WD | 87 |
| Toyota Tundra double cab 4WD | 87 |
| Chevrolet Suburban 1500 4dr 4WD | 99 |
| Ford Expedition EL 4dr 4WD | 85 |
| GMC Yukon XL 1500 4dr 4WD | 111 |
| Buick Enclave 4dr 4WD | 94 |
| Chevrolet Tahoe 4dr 4WD | 86 |
| Chevrolet Traverse 4dr 4WD | 73 |
| Dodge Durango 4dr 4WD | 96 |
| GMC Acadia 4dr 4WD | 81 |
| Toyota Sequoia 4dr 4WD | 82 |
| Ford Edge 4dr 4WD | 86 |
| Ford Flex 4dr 4WD | 92 |
| Honda Pilot 4dr 4WD | 81 |
| Hyundai Santa Fe Sport 4dr 4WD | 92 |
| Nissan Murano 4dr 4WD | 99 |
| Toyota Highlander 4dr 4WD | 94 |
| Honda CR-V 4dr 4WD | 69 |
| Kia Sportage 4dr 4WD | 89 |
| Nissan Rogue 4dr 4WD | 96 |
| Toyota RAV4 4dr 4WD | 93 |
| Infiniti QX80 4dr 4WD | 120 |
| Lexus LX 570 4dr 4WD | 140 |
| Porsche Cayenne 4dr 4WD | 173 |
| Tesla Model X 4dr electric 4WD | 266 |
| Toyota Land Cruiser 4dr 4WD | 103 |
| Cadillac Escalade ESV 4dr 4WD | 118 |
It’s easy to tell by the numbers which vehicles have higher and lower collision insurance costs. Higher-priced vehicles cost more to insure, and even costs to insure the same model but different trim level can be significantly different.
Hybrid and vehicles have more expensive collision insurance rates than their non-hybrid siblings due to the more expensive electric drive train components and potential for damage to the battery packs.
When it comes to car insurance, accident analytics and collision claim history are two of the tools used by companies to help forecast claims and set appropriate premium levels for each vehicle model. The next time you ask why collision insurance is so expensive for a particular model, you’ll know the answer.
Use our FREE quote tool to compare insurance rates now!

Frequently Asked Questions
Which vehicles are considered the best for overall collision losses?
The vehicles considered the best for overall collision losses are those that tend to have lower claim frequencies and lower costs of repairs. These vehicles typically have advanced safety features and robust structural designs. It’s important to note that the specific rankings and models can vary depending on the source and the methodology used for analysis. However, vehicles commonly recognized for their low collision losses include certain sedans, minivans, and SUVs with advanced safety technology and good crash test ratings.
What factors contribute to a vehicle’s collision losses?
Several factors contribute to a vehicle’s collision losses, including:
- Repair costs: The cost to repair a specific make and model can impact collision losses. Vehicles with expensive parts or complex repair processes may have higher losses.
- Claim frequencies: The frequency of claims filed for a particular vehicle affects its collision loss rankings. Vehicles with higher claim frequencies tend to have higher collision losses.
- Safety features: Vehicles equipped with advanced safety features, such as collision warning systems, lane departure warning, or automatic emergency braking, often have lower collision losses due to their ability to prevent accidents or mitigate their severity.
- Crashworthiness: Vehicles with good crash test ratings and strong structural designs tend to have lower collision losses, as they provide better protection to occupants in the event of an accident.
Are there specific vehicles that are considered the worst for overall collision losses?
While it’s challenging to pinpoint the absolute worst vehicles for overall collision losses, certain models may have higher claim frequencies or more expensive repairs, leading to higher losses. These can include luxury vehicles, sports cars, and certain SUVs or trucks. However, it’s important to consider that each vehicle’s performance in terms of collision losses can vary depending on specific factors such as driver behavior, geographical location, and other variables.
Where can I find reliable information on collision losses for different vehicle models?
Several organizations and institutions provide reliable information on collision losses for different vehicle models. These include reputable insurance industry sources, government agencies, and independent research organizations. Some common sources of information include the Insurance Institute for Highway Safety (IIHS), the National Highway Traffic Safety Administration (NHTSA), and various automotive research publications. Consulting multiple sources and considering their methodologies can provide a more comprehensive understanding of collision losses for different vehicle models.
Should collision losses be the sole factor in choosing a vehicle?
While collision losses are an important consideration when choosing a vehicle, they should not be the sole factor. Other factors such as fuel efficiency, reliability, overall safety ratings, cost of ownership, and personal preferences should also be taken into account. It’s advisable to evaluate a vehicle holistically, considering its performance in various areas and how well it aligns with your specific needs and priorities.
How can I lower collision losses for my vehicle?
While you cannot directly control collision losses for a specific vehicle model, you can take steps to potentially lower your individual collision losses. These include:
- Safe driving habits: Practicing defensive driving techniques and following traffic laws can reduce the likelihood of accidents and lower your collision losses.
- Regular maintenance: Maintaining your vehicle in good condition, including routine inspections, tire rotations, and addressing any necessary repairs promptly, can help prevent accidents caused by mechanical failures.
- Advanced safety features: If your vehicle allows for it, equipping it with additional advanced safety features, such as a dashcam, blind-spot monitoring, or parking sensors, can enhance your safety and potentially reduce collision losses.
- Proper insurance coverage: Ensure you have adequate collision coverage in your auto insurance policy to protect against repair costs in the event of an accident.
Do collision losses impact insurance premiums?
Yes, collision losses can impact insurance premiums. Insurance companies consider various factors when determining premiums, and a vehicle’s collision losses can be one of those factors. Vehicles with higher collision losses may be associated with a higher risk of accidents or expensive repairs, which can result in higher premiums. Conversely, vehicles with lower collision losses may be viewed as less risky to insure and may have lower premiums. However, it’s important to note that collision losses are just one of many factors that insurers consider, and your individual circumstances and driving history also play a significant role in determining your insurance premiums.
Frequently Asked Questions
- What is a named operator policy?
- Will Geico insure a car not in my name?
- What Is Covered in a Jeep Powertrain Warranty? 2026
- Cheapest Jeep Insurance Rates in 2026
- Do trucks cost more to insure?
- How long does a DUI stay on your record?
- Does the Porsche Club of America offer car insurance?
- View All Coverage Questions
Popular Rate Quotes
- Ford Fusion Insurance
- Ford Edge Insurance
- Ford F-150 Insurance
- Honda Civic Insurance
- Chevrolet Silverado Insurance
- Nissan Rogue Insurance
- Honda CR-V Insurance
- Dodge Ram Insurance
- Toyota Camry Insurance
Compare Rates and Save
Find companies with the cheapest rates in your area