Volvo XC90 Insurance Rates
Enter your zip code below to view companies that have cheap auto insurance rates.
Michelle Robbins
Licensed Insurance Agent
Michelle Robbins has been a licensed insurance agent for over 13 years. Her career began in the real estate industry, supporting local realtors with Title Insurance. After several years, Michelle shifted to real estate home warranty insurance, where she managed a territory of over 100 miles of real estate professionals. Later, Agent Robbins obtained more licensing and experience serving families a...
Licensed Insurance Agent
UPDATED: May 8, 2024
It’s all about you. We want to help you make the right coverage choices.
Advertiser Disclosure: We strive to help you make confident car insurance decisions. Comparison shopping should be easy. We are not affiliated with any one car insurance provider and cannot guarantee quotes from any single provider.
Our insurance industry partnerships don’t influence our content. Our opinions are our own. To compare quotes from many different companies please enter your ZIP code on this page to use the free quote tool. The more quotes you compare, the more chances to save.
Editorial Guidelines: We are a free online resource for anyone interested in learning more about auto insurance. Our goal is to be an objective, third-party resource for everything auto insurance related. We update our site regularly, and all content is reviewed by auto insurance experts.
Average insurance rates for a Volvo XC90 are $1,050 a year including full coverage. Comprehensive costs around $180, collision costs $238, and liability is $474. A policy with just liability insurance costs around $522 a year, with coverage for high-risk drivers costing around $2,256. Teenage drivers receive the highest rates at $4,188 a year or more.
Average premium for full coverage: $1,050
Rate estimates for individual coverage type:
Full coverage includes $500 deductibles, 30/60 bodily injury liability limits, and includes both medical and uninsured motorist insurance. Rates are averaged for all 50 U.S. states and for all XC90 models.
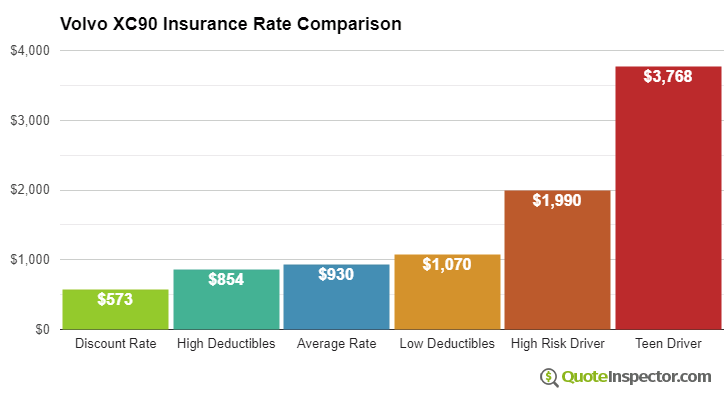
Price Range by Coverage and Risk
For a driver in their 40's, prices range go from as low as $522 for minimum levels of liability insurance to the much higher price of $2,256 for a driver who requires high-risk insurance.
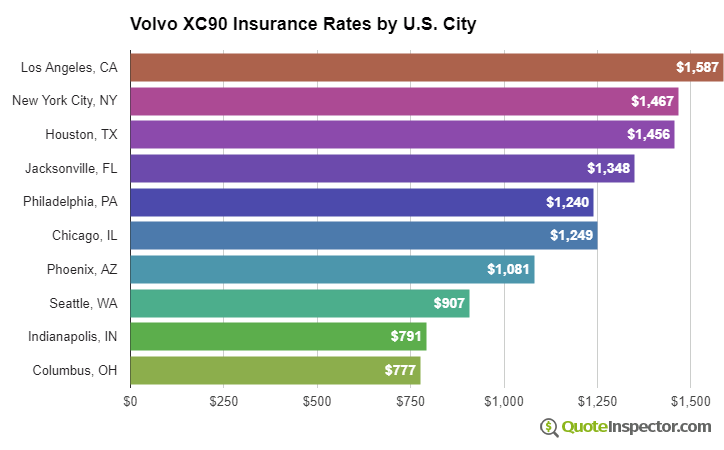
Price Range by Location
Choosing to live in a large city can make a big difference on the price of insurance. Areas with sparse population tend to have a lower frequency of comprehensive and collision claims than densely populated cities.
The example below illustrates how location helps determine auto insurance rates.
These examples highlight why everyone should compare rates quotes for a specific zip code and risk profile, instead of making a decision based on average rates.
Use the form below to get customized rates for your location.
Enter your zip code below to view companies based on your location that have cheap auto insurance rates.
Additional Rate Details
The chart below breaks down estimated Volvo XC90 insurance rates for additional coverage choices and driver risks.
- The best discount rate is $635
- Raising to $1,000 deductibles will save about $96 every year
- The average rate for a 40-year-old driver using $500 deductibles is $1,050
- Using pricier low deductibles will increase the cost to $1,230
- Drivers who are prone to accidents and violations could pay at least $2,256 or more
- The cost for full coverage for a 16-year-old driver for full coverage can be $4,188
Insurance rates for a Volvo XC90 can also vary considerably based on your driver profile, the model of your XC90, and deductibles and policy limits.
A more mature driver with no violations or accidents and high deductibles may pay as low as $1,000 every 12 months on average for full coverage. Rates are much higher for teen drivers, where even good drivers should be prepared to pay as much as $4,100 a year. View Rates by Age
Where you live also has a big influence on Volvo XC90 insurance prices. A middle-age driver might find rates as low as $810 a year in states like Missouri, New Hampshire, and Vermont, or be forced to pay as much as $1,500 on average in Michigan, New York, and Louisiana.
| State | Premium | Compared to U.S. Avg | Percent Difference |
|---|---|---|---|
| Alabama | $948 | -$102 | -9.7% |
| Alaska | $804 | -$246 | -23.4% |
| Arizona | $872 | -$178 | -17.0% |
| Arkansas | $1,050 | -$0 | 0.0% |
| California | $1,196 | $146 | 13.9% |
| Colorado | $1,002 | -$48 | -4.6% |
| Connecticut | $1,078 | $28 | 2.7% |
| Delaware | $1,188 | $138 | 13.1% |
| Florida | $1,312 | $262 | 25.0% |
| Georgia | $968 | -$82 | -7.8% |
| Hawaii | $754 | -$296 | -28.2% |
| Idaho | $708 | -$342 | -32.6% |
| Illinois | $780 | -$270 | -25.7% |
| Indiana | $790 | -$260 | -24.8% |
| Iowa | $708 | -$342 | -32.6% |
| Kansas | $998 | -$52 | -5.0% |
| Kentucky | $1,432 | $382 | 36.4% |
| Louisiana | $1,552 | $502 | 47.8% |
| Maine | $646 | -$404 | -38.5% |
| Maryland | $864 | -$186 | -17.7% |
| Massachusetts | $840 | -$210 | -20.0% |
| Michigan | $1,822 | $772 | 73.5% |
| Minnesota | $876 | -$174 | -16.6% |
| Mississippi | $1,256 | $206 | 19.6% |
| Missouri | $930 | -$120 | -11.4% |
| Montana | $1,128 | $78 | 7.4% |
| Nebraska | $828 | -$222 | -21.1% |
| Nevada | $1,258 | $208 | 19.8% |
| New Hampshire | $756 | -$294 | -28.0% |
| New Jersey | $1,174 | $124 | 11.8% |
| New Mexico | $930 | -$120 | -11.4% |
| New York | $1,106 | $56 | 5.3% |
| North Carolina | $604 | -$446 | -42.5% |
| North Dakota | $860 | -$190 | -18.1% |
| Ohio | $724 | -$326 | -31.0% |
| Oklahoma | $1,078 | $28 | 2.7% |
| Oregon | $960 | -$90 | -8.6% |
| Pennsylvania | $1,002 | -$48 | -4.6% |
| Rhode Island | $1,398 | $348 | 33.1% |
| South Carolina | $950 | -$100 | -9.5% |
| South Dakota | $886 | -$164 | -15.6% |
| Tennessee | $920 | -$130 | -12.4% |
| Texas | $1,264 | $214 | 20.4% |
| Utah | $778 | -$272 | -25.9% |
| Vermont | $718 | -$332 | -31.6% |
| Virginia | $628 | -$422 | -40.2% |
| Washington | $812 | -$238 | -22.7% |
| West Virginia | $960 | -$90 | -8.6% |
| Wisconsin | $726 | -$324 | -30.9% |
| Wyoming | $936 | -$114 | -10.9% |
Using high physical damage deductibles can reduce rates by up to $280 annually, whereas buying more liability protection will increase rates. Changing from a 50/100 limit to a 250/500 limit will cost as much as $426 more each year. View Rates by Deductible or Liability Limit
If you like to drive fast or tend to cause accidents, you are likely paying at least $1,200 to $1,800 additional per year, depending on your age. Volvo XC90 insurance for high-risk drivers is expensive and can cost from 43% to 127% more than a normal policy. View High Risk Driver Rates
With so much variability in rates, the best way to figure out your exact price is to regularly compare rates from multiple companies. Every auto insurance company uses a different method to calculate rates, and rates can be significantly different from one company to the next.
Insurance Rates by Trim Level and Model Year
| Model and Trim | Annual Premium | Monthly Premium |
|---|---|---|
| Volvo XC90 3.2 2WD | $1,032 | $86 |
| Volvo XC90 3.2 R-Design 2WD | $1,032 | $86 |
| Volvo XC90 3.2 AWD | $1,068 | $89 |
| Volvo XC90 V8 AWD | $1,068 | $89 |
Rates assume 2011 model year, a 40-year-old male driver with no accidents or violations, $500 comprehensive and collision deductibles, minimum liability limits, and uninsured/under-insured motorist coverage included. Rates are for comparison only and are averaged for all 50 U.S. states.
| Model Year | Comprehensive | Collision | Liability | Total Premium |
|---|---|---|---|---|
| 2024 Volvo XC90 | $332 | $596 | $398 | $1,484 |
| 2023 Volvo XC90 | $320 | $582 | $416 | $1,476 |
| 2022 Volvo XC90 | $310 | $558 | $430 | $1,456 |
| 2021 Volvo XC90 | $292 | $538 | $442 | $1,430 |
| 2020 Volvo XC90 | $282 | $500 | $452 | $1,392 |
| 2019 Volvo XC90 | $270 | $470 | $456 | $1,354 |
| 2018 Volvo XC90 | $258 | $422 | $460 | $1,298 |
| 2017 Volvo XC90 | $242 | $388 | $460 | $1,248 |
| 2016 Volvo XC90 | $234 | $364 | $464 | $1,220 |
| 2014 Volvo XC90 | $210 | $316 | $474 | $1,158 |
| 2013 Volvo XC90 | $206 | $286 | $478 | $1,128 |
| 2012 Volvo XC90 | $192 | $262 | $474 | $1,086 |
| 2011 Volvo XC90 | $180 | $238 | $474 | $1,050 |
| 2010 Volvo XC90 | $174 | $214 | $468 | $1,014 |
Rates are averaged for all Volvo XC90 models and trim levels. Rates assume a 40-year-old male driver, full coverage with $500 deductibles, and a clean driving record.
How to Find More Affordable Volvo XC90 Insurance
Saving money on insurance for a Volvo XC90 consists of not taking risks behind the wheel, having a good credit history, not filing small claims, and taking advantage of discounts. Invest time comparing rates at every other renewal by obtaining price quotes from direct car insurance companies like GEICO and Progressive, and also from several local insurance agents.
The following is a summary of the concepts that were covered in the charts and tables above.
- Drivers considered higher risk who have multiple accidents or major violations pay on average $1,210 more every year for XC90 insurance
- Teens are charged the highest rates, as much as $349 per month including comprehensive and collision insurance
- You may be able to save up to $120 per year simply by quoting online well ahead of the renewal date
- Increasing deductibles can save around $275 each year
- You may be able to save up to $120 per year simply by quoting online well ahead of the renewal date
Rate Tables and Charts
Rates by Driver Age
| Driver Age | Premium |
|---|---|
| 16 | $4,188 |
| 20 | $2,396 |
| 30 | $1,070 |
| 40 | $1,050 |
| 50 | $962 |
| 60 | $942 |
Full coverage, $500 deductibles
Rates by Deductible
| Deductible | Premium |
|---|---|
| $100 | $1,230 |
| $250 | $1,148 |
| $500 | $1,050 |
| $1,000 | $954 |
Full coverage, driver age 40
Rates by Liability Limit
| Liability Limit | Premium |
|---|---|
| 30/60 | $1,050 |
| 50/100 | $1,163 |
| 100/300 | $1,281 |
| 250/500 | $1,589 |
| 100 CSL | $1,210 |
| 300 CSL | $1,471 |
| 500 CSL | $1,661 |
Full coverage, driver age 40
Rates for High Risk Drivers
| Age | Premium |
|---|---|
| 16 | $5,904 |
| 20 | $3,818 |
| 30 | $2,278 |
| 40 | $2,256 |
| 50 | $2,158 |
| 60 | $2,136 |
Full coverage, $500 deductibles, two speeding tickets, and one at-fault accident
If a financial responsibility filing is required, the additional charge below may also apply.
Potential Rate Discounts
If you qualify for discounts, you may save the amounts shown below.
| Discount | Savings |
|---|---|
| Multi-policy | $54 |
| Multi-vehicle | $56 |
| Homeowner | $18 |
| 5-yr Accident Free | $65 |
| 5-yr Claim Free | $66 |
| Paid in Full/EFT | $39 |
| Advance Quote | $46 |
| Online Quote | $71 |
| Total Discounts | $415 |
Discounts are estimated and may not be available from every company or in every state.
Compare Rates and Save
Find companies with the cheapest rates in your area