Toyota Crown Insurance Rates
Enter your zip code below to view companies that have cheap auto insurance rates.
Michelle Robbins
Licensed Insurance Agent
Michelle Robbins has been a licensed insurance agent for over 13 years. Her career began in the real estate industry, supporting local realtors with Title Insurance. After several years, Michelle shifted to real estate home warranty insurance, where she managed a territory of over 100 miles of real estate professionals. Later, Agent Robbins obtained more licensing and experience serving families a...
Licensed Insurance Agent
UPDATED: Mar 28, 2024
It’s all about you. We want to help you make the right coverage choices.
Advertiser Disclosure: We strive to help you make confident car insurance decisions. Comparison shopping should be easy. We are not affiliated with any one car insurance provider and cannot guarantee quotes from any single provider.
Our insurance industry partnerships don’t influence our content. Our opinions are our own. To compare quotes from many different companies please enter your ZIP code on this page to use the free quote tool. The more quotes you compare, the more chances to save.
Editorial Guidelines: We are a free online resource for anyone interested in learning more about auto insurance. Our goal is to be an objective, third-party resource for everything auto insurance related. We update our site regularly, and all content is reviewed by auto insurance experts.
U.S. average insurance rates for a Toyota Crown are $1,530 a year including full coverage. Comprehensive insurance costs on average $370, collision costs $686, and liability costs around $338. A policy with just liability insurance costs as low as $394 a year, with coverage for high-risk drivers costing $3,310 or more. Teen drivers pay the highest rates at $5,472 a year or more.
Average premium for full coverage: $1,530
Price estimates by individual coverage:
Prices are based on $500 physical damage insurance deductibles, liability limits of 30/60, and includes uninsured motorist and medical coverage. Estimates are averaged for all 50 U.S. states and for different Crown trim levels.
Price Range from Low to High
For the average 40-year-old driver, Toyota Crown insurance prices go from the low end price of $394 for the bare minimum liability coverage to a much higher rate of $3,310 for a driver that may need high-risk insurance.
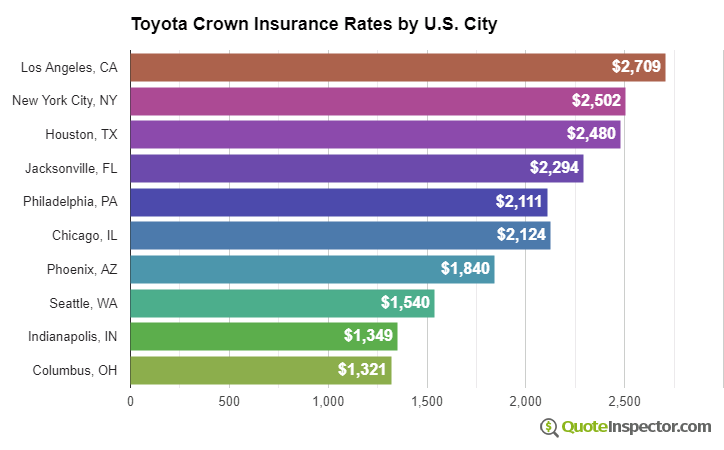
Geographic Price Range
Where you live can make a big difference on car insurance rates. Rural areas have lower incidents of comprehensive and collision claims than larger metro areas.
The price range example below illustrates the difference location can make on car insurance rates.
The ranges above highlight why anyone shopping for car insurance should compare prices based on a specific location, instead of making a decision based on price averages.
Use the form below to get customized rates for your location.
Enter your zip code below to view companies based on your location that have cheap auto insurance rates.
Additional Rate Information
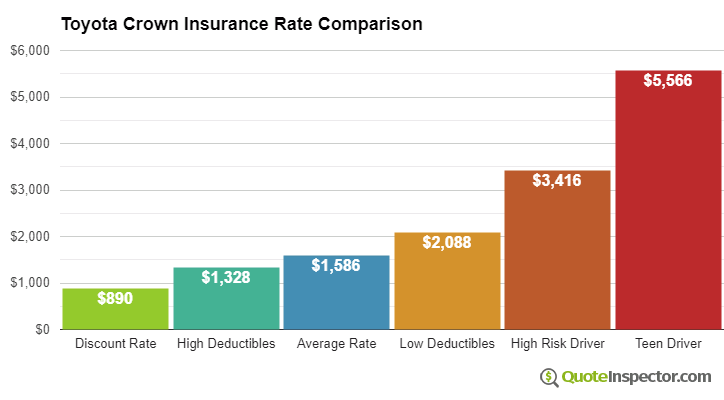
The chart below breaks down estimated Toyota Crown insurance rates for different risk profiles and scenarios.
- The lowest rate with discounts is $858
- Using higher $1,000 deductibles will save around $242 every year
- The estimated price for the average middle-age driver with $500 deductibles is $1,530
- Choosing more expensive low deductibles for physical damage coverage will cost an additional $464 annually
- High-risk insureds with multiple violations and an at-fault accident could pay upwards of $3,310 or more
- The price that insures a 16-year-old driver with full coverage may cost $5,472 or more
Insurance prices for a Toyota Crown are also quite variable based on the model year and trim level, your driving record and age, and policy deductibles and limits.
If you have some driving violations or you caused an accident, you are likely paying at a minimum $1,800 to $2,400 extra each year, depending on your age. High-risk driver insurance can be from 44% to 131% more than average. View High Risk Driver Rates
An older driver with a clean driving record and higher comprehensive and collision deductibles may pay as low as $1,400 a year for full coverage. Prices are highest for teenage drivers, since even teens with perfect driving records can expect to pay upwards of $5,400 a year. View Rates by Age
The state you live in has a huge impact on Toyota Crown insurance prices. A driver around age 40 might see prices as low as $1,170 a year in states like Missouri, New Hampshire, and Vermont, or as much as $2,180 on average in Michigan, New York, and Louisiana.
| State | Premium | Compared to U.S. Avg | Percent Difference |
|---|---|---|---|
| Alabama | $1,382 | -$148 | -9.7% |
| Alaska | $1,174 | -$356 | -23.3% |
| Arizona | $1,268 | -$262 | -17.1% |
| Arkansas | $1,530 | -$0 | 0.0% |
| California | $1,742 | $212 | 13.9% |
| Colorado | $1,458 | -$72 | -4.7% |
| Connecticut | $1,570 | $40 | 2.6% |
| Delaware | $1,730 | $200 | 13.1% |
| Florida | $1,910 | $380 | 24.8% |
| Georgia | $1,412 | -$118 | -7.7% |
| Hawaii | $1,100 | -$430 | -28.1% |
| Idaho | $1,036 | -$494 | -32.3% |
| Illinois | $1,138 | -$392 | -25.6% |
| Indiana | $1,152 | -$378 | -24.7% |
| Iowa | $1,030 | -$500 | -32.7% |
| Kansas | $1,450 | -$80 | -5.2% |
| Kentucky | $2,084 | $554 | 36.2% |
| Louisiana | $2,262 | $732 | 47.8% |
| Maine | $944 | -$586 | -38.3% |
| Maryland | $1,262 | -$268 | -17.5% |
| Massachusetts | $1,220 | -$310 | -20.3% |
| Michigan | $2,654 | $1,124 | 73.5% |
| Minnesota | $1,282 | -$248 | -16.2% |
| Mississippi | $1,830 | $300 | 19.6% |
| Missouri | $1,356 | -$174 | -11.4% |
| Montana | $1,640 | $110 | 7.2% |
| Nebraska | $1,202 | -$328 | -21.4% |
| Nevada | $1,832 | $302 | 19.7% |
| New Hampshire | $1,102 | -$428 | -28.0% |
| New Jersey | $1,708 | $178 | 11.6% |
| New Mexico | $1,352 | -$178 | -11.6% |
| New York | $1,608 | $78 | 5.1% |
| North Carolina | $880 | -$650 | -42.5% |
| North Dakota | $1,252 | -$278 | -18.2% |
| Ohio | $1,052 | -$478 | -31.2% |
| Oklahoma | $1,568 | $38 | 2.5% |
| Oregon | $1,400 | -$130 | -8.5% |
| Pennsylvania | $1,458 | -$72 | -4.7% |
| Rhode Island | $2,038 | $508 | 33.2% |
| South Carolina | $1,384 | -$146 | -9.5% |
| South Dakota | $1,290 | -$240 | -15.7% |
| Tennessee | $1,338 | -$192 | -12.5% |
| Texas | $1,842 | $312 | 20.4% |
| Utah | $1,132 | -$398 | -26.0% |
| Vermont | $1,044 | -$486 | -31.8% |
| Virginia | $916 | -$614 | -40.1% |
| Washington | $1,180 | -$350 | -22.9% |
| West Virginia | $1,400 | -$130 | -8.5% |
| Wisconsin | $1,056 | -$474 | -31.0% |
| Wyoming | $1,360 | -$170 | -11.1% |
Choosing high deductibles could cut prices by as much as $710 annually, while increasing your policy's liability limits will cost you more. Changing from a 50/100 bodily injury protection limit to a 250/500 limit will increase prices by as much as $304 more per year. View Rates by Deductible or Liability Limit
Since prices can be so different, the best way to figure out exactly what you will pay is to compare prices from multiple companies. Each insurance company uses a different rate calculation, so the prices may be quite different.
| Model Year | Comprehensive | Collision | Liability | Total Premium |
|---|---|---|---|---|
| 2024 Toyota Crown | $370 | $686 | $338 | $1,530 |
| 2023 Toyota Crown | $356 | $668 | $354 | $1,514 |
Rates are averaged for all Toyota Crown models and trim levels. Rates assume a 40-year-old male driver, full coverage with $500 deductibles, and a clean driving record.
How to Find Affordable Toyota Crown Insurance
Getting lower rates on insurance for a Toyota Crown requires being a low-risk driver, having above-average credit, being claim-free, and bundling your home and auto policies. Shop around once a year by quoting rates from direct car insurance companies, and also from insurance agencies where you live.
The items below are a brief review of the data that was touched on in this article.
- You may be able to save as much as $190 per year simply by shopping early and online
- Insureds who require more liability coverage will pay about $370 per year to increase from a low limit to the 250/500 level
- Teen drivers pay the highest prices, possibly costing $456 a month if full coverage is included
- Drivers considered higher risk with DUI or reckless driving convictions could be forced to pay on average $1,780 more each year to insure their Crown
Rate Tables and Charts
Rates by Driver Age
| Driver Age | Premium |
|---|---|
| 16 | $5,472 |
| 20 | $3,524 |
| 30 | $1,610 |
| 40 | $1,530 |
| 50 | $1,394 |
| 60 | $1,370 |
Full coverage, $500 deductibles
Rates by Deductible
| Deductible | Premium |
|---|---|
| $100 | $1,994 |
| $250 | $1,778 |
| $500 | $1,530 |
| $1,000 | $1,288 |
Full coverage, driver age 40
Rates by Liability Limit
| Liability Limit | Premium |
|---|---|
| 30/60 | $1,530 |
| 50/100 | $1,598 |
| 100/300 | $1,682 |
| 250/500 | $1,902 |
| 100 CSL | $1,631 |
| 300 CSL | $1,817 |
| 500 CSL | $1,953 |
Full coverage, driver age 40
Rates for High Risk Drivers
| Age | Premium |
|---|---|
| 16 | $7,862 |
| 20 | $5,606 |
| 30 | $3,404 |
| 40 | $3,310 |
| 50 | $3,152 |
| 60 | $3,126 |
Full coverage, $500 deductibles, two speeding tickets, and one at-fault accident
If a financial responsibility filing is required, the additional charge below may also apply.
Potential Rate Discounts
If you qualify for discounts, you may save the amounts shown below.
| Discount | Savings |
|---|---|
| Multi-policy | $84 |
| Multi-vehicle | $79 |
| Homeowner | $21 |
| 5-yr Accident Free | $121 |
| 5-yr Claim Free | $100 |
| Paid in Full/EFT | $76 |
| Advance Quote | $79 |
| Online Quote | $112 |
| Total Discounts | $672 |
Discounts are estimated and may not be available from every company or in every state.
Compare Rates and Save
Find companies with the cheapest rates in your area