Toyota Corolla Cross Insurance Rates
Enter your zip code below to view companies that have cheap auto insurance rates.
Michelle Robbins
Licensed Insurance Agent
Michelle Robbins has been a licensed insurance agent for over 13 years. Her career began in the real estate industry, supporting local realtors with Title Insurance. After several years, Michelle shifted to real estate home warranty insurance, where she managed a territory of over 100 miles of real estate professionals. Later, Agent Robbins obtained more licensing and experience serving families a...
Licensed Insurance Agent
UPDATED: Mar 28, 2024
It’s all about you. We want to help you make the right coverage choices.
Advertiser Disclosure: We strive to help you make confident car insurance decisions. Comparison shopping should be easy. We are not affiliated with any one car insurance provider and cannot guarantee quotes from any single provider.
Our insurance industry partnerships don’t influence our content. Our opinions are our own. To compare quotes from many different companies please enter your ZIP code on this page to use the free quote tool. The more quotes you compare, the more chances to save.
Editorial Guidelines: We are a free online resource for anyone interested in learning more about auto insurance. Our goal is to be an objective, third-party resource for everything auto insurance related. We update our site regularly, and all content is reviewed by auto insurance experts.
Average insurance rates for a Toyota Corolla Cross are $1,204 a year for full coverage. Comprehensive insurance costs approximately $248 a year, collision insurance costs $466, and liability coverage is estimated at $354. A policy with just liability insurance costs approximately $406 a year, and coverage for high-risk drivers costs $2,608 or more. Teens receive the highest rates at up to $4,500 a year.
Average premium for full coverage: $1,204
Rate estimates by individual coverage type:
Full coverage includes $500 deductibles, split liability limits of 30/60, and includes additional medical/uninsured motorist coverage. Rates are averaged for all states and Corolla Cross trim levels.
Price Range by Coverage and Risk
For the normal driver, prices range range from the low end price of $406 for just the minimum liability insurance to a high of $2,608 for coverage for higher-risk drivers.
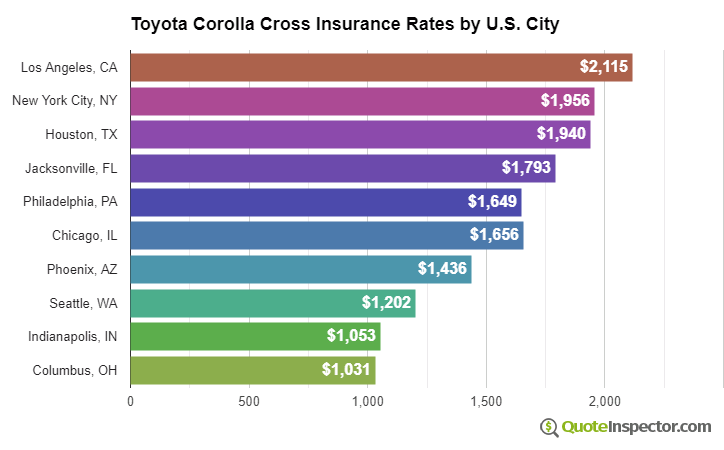
Price Range by Location
Living in a larger city has a large influence on car insurance rates. Rural locations tend to have lower incidents of accident claims than cities with more traffic congestion. The diagram below illustrates how geographic area affects auto insurance prices.
These examples show why it is important to get quotes using their specific location, rather than using averaged prices.
Use the form below to get customized rates for your location.
Enter your zip code below to view companies based on your location that have cheap auto insurance rates.
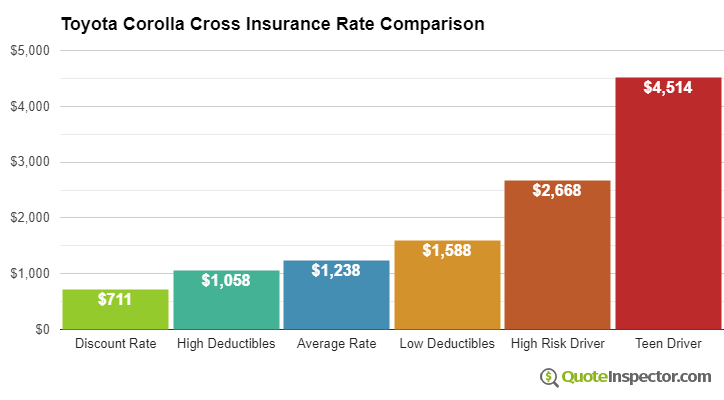
Additional Rate Analysis
The chart below shows average Toyota Corolla Cross insurance rates for additional coverage and risk scenarios.
- The cheapest rate after discounts is $692
- Choosing higher $1,000 deductibles can save $1,042 a year
- The estimated price for a 40-year-old driver who chooses $500 deductibles is $1,204
- Selecting low $100 deductibles for comp and collision coverage will cost an additional $316 each year
- Drivers with serious driving violations could pay around $2,608
- The cost that insures a teenage driver can cost $4,500 each year
Insurance rates for a Toyota Corolla Cross can also vary considerably based on the trim level of your Corolla Cross, how you drive, and physical damage deductibles and liability limits.
If you like to drive fast or you caused an accident, you could be paying anywhere from $1,400 to $2,000 additional per year, depending on your age. A high-risk auto insurance policy ranges around 44% to 130% more than the average policy. View High Risk Driver Rates
Older drivers with no violations or accidents and higher comprehensive and collision deductibles may only pay around $1,100 annually on average for full coverage. Rates are much higher for teen drivers, since even teens with perfect driving records should be prepared to pay in the ballpark of $4,500 a year. View Rates by Age
Where you live plays a big part in determining prices for Toyota Corolla Cross insurance rates. A good driver about age 40 could pay as low as $790 a year in states like Iowa, Maine, and Idaho, or have to pay at least $1,720 on average in New York, Louisiana, and Michigan.
| State | Premium | Compared to U.S. Avg | Percent Difference |
|---|---|---|---|
| Alabama | $1,086 | -$118 | -9.8% |
| Alaska | $922 | -$282 | -23.4% |
| Arizona | $998 | -$206 | -17.1% |
| Arkansas | $1,204 | -$0 | 0.0% |
| California | $1,370 | $166 | 13.8% |
| Colorado | $1,146 | -$58 | -4.8% |
| Connecticut | $1,234 | $30 | 2.5% |
| Delaware | $1,358 | $154 | 12.8% |
| Florida | $1,502 | $298 | 24.8% |
| Georgia | $1,110 | -$94 | -7.8% |
| Hawaii | $864 | -$340 | -28.2% |
| Idaho | $816 | -$388 | -32.2% |
| Illinois | $896 | -$308 | -25.6% |
| Indiana | $906 | -$298 | -24.8% |
| Iowa | $810 | -$394 | -32.7% |
| Kansas | $1,142 | -$62 | -5.1% |
| Kentucky | $1,640 | $436 | 36.2% |
| Louisiana | $1,782 | $578 | 48.0% |
| Maine | $742 | -$462 | -38.4% |
| Maryland | $992 | -$212 | -17.6% |
| Massachusetts | $958 | -$246 | -20.4% |
| Michigan | $2,086 | $882 | 73.3% |
| Minnesota | $1,008 | -$196 | -16.3% |
| Mississippi | $1,440 | $236 | 19.6% |
| Missouri | $1,068 | -$136 | -11.3% |
| Montana | $1,290 | $86 | 7.1% |
| Nebraska | $946 | -$258 | -21.4% |
| Nevada | $1,442 | $238 | 19.8% |
| New Hampshire | $866 | -$338 | -28.1% |
| New Jersey | $1,344 | $140 | 11.6% |
| New Mexico | $1,064 | -$140 | -11.6% |
| New York | $1,264 | $60 | 5.0% |
| North Carolina | $692 | -$512 | -42.5% |
| North Dakota | $986 | -$218 | -18.1% |
| Ohio | $830 | -$374 | -31.1% |
| Oklahoma | $1,232 | $28 | 2.3% |
| Oregon | $1,102 | -$102 | -8.5% |
| Pennsylvania | $1,146 | -$58 | -4.8% |
| Rhode Island | $1,602 | $398 | 33.1% |
| South Carolina | $1,090 | -$114 | -9.5% |
| South Dakota | $1,014 | -$190 | -15.8% |
| Tennessee | $1,052 | -$152 | -12.6% |
| Texas | $1,448 | $244 | 20.3% |
| Utah | $890 | -$314 | -26.1% |
| Vermont | $822 | -$382 | -31.7% |
| Virginia | $720 | -$484 | -40.2% |
| Washington | $930 | -$274 | -22.8% |
| West Virginia | $1,102 | -$102 | -8.5% |
| Wisconsin | $830 | -$374 | -31.1% |
| Wyoming | $1,068 | -$136 | -11.3% |
Choosing higher comprehensive and collision insurance deductibles can save as much as $480 a year, while buying higher liability limits will push rates upward. Going from a 50/100 bodily injury protection limit to a 250/500 limit will cost as much as $318 more each year. View Rates by Deductible or Liability Limit
| Model Year | Comprehensive | Collision | Liability | Total Premium |
|---|---|---|---|---|
| 2024 Toyota Corolla Cross | $256 | $478 | $338 | $1,208 |
| 2023 Toyota Corolla Cross | $248 | $466 | $354 | $1,204 |
| 2022 Toyota Corolla Cross | $240 | $446 | $364 | $1,186 |
Rates are averaged for all Toyota Corolla Cross models and trim levels. Rates assume a 40-year-old male driver, full coverage with $500 deductibles, and a clean driving record.
How to Find More Affordable Toyota Corolla Cross Insurance
Saving money on auto insurance takes not taking risks behind the wheel, having a good credit score, eliminating unneeded coverage, and consideration of higher deductibles. Compare rates at least once a year by getting quotes from direct carriers like Progressive, GEICO, and Esurance, and also from insurance agencies where you live.
The following is a summary of the primary concepts that were presented in the illustrations above.
- Drivers can save around $150 per year just by quoting early and online
- Drivers who have multiple accidents or major violations could be forced to pay on average $1,400 more per year for Corolla Cross insurance
- Increasing deductibles can save approximately $475 each year
- Teens are the costliest to insure, costing as high as $375 per month if comprehensive and collision insurance is included
Rate Tables and Charts
Rates by Driver Age
| Driver Age | Premium |
|---|---|
| 16 | $4,500 |
| 20 | $2,784 |
| 30 | $1,254 |
| 40 | $1,204 |
| 50 | $1,100 |
| 60 | $1,080 |
Full coverage, $500 deductibles
Rates by Deductible
| Deductible | Premium |
|---|---|
| $100 | $1,520 |
| $250 | $1,372 |
| $500 | $1,204 |
| $1,000 | $1,042 |
Full coverage, driver age 40
Rates by Liability Limit
| Liability Limit | Premium |
|---|---|
| 30/60 | $1,204 |
| 50/100 | $1,275 |
| 100/300 | $1,363 |
| 250/500 | $1,593 |
| 100 CSL | $1,310 |
| 300 CSL | $1,505 |
| 500 CSL | $1,647 |
Full coverage, driver age 40
Rates for High Risk Drivers
| Age | Premium |
|---|---|
| 16 | $6,426 |
| 20 | $4,430 |
| 30 | $2,666 |
| 40 | $2,608 |
| 50 | $2,486 |
| 60 | $2,464 |
Full coverage, $500 deductibles, two speeding tickets, and one at-fault accident
If a financial responsibility filing is required, the additional charge below may also apply.
Potential Rate Discounts
If you qualify for discounts, you may save the amounts shown below.
| Discount | Savings |
|---|---|
| Multi-policy | $64 |
| Multi-vehicle | $63 |
| Homeowner | $18 |
| 5-yr Accident Free | $89 |
| 5-yr Claim Free | $78 |
| Paid in Full/EFT | $55 |
| Advance Quote | $60 |
| Online Quote | $85 |
| Total Discounts | $512 |
Discounts are estimated and may not be available from every company or in every state.
Compare Rates and Save
Find companies with the cheapest rates in your area