Cadillac XTS Insurance Rates
Enter your zip code below to view companies that have cheap auto insurance rates.
Michelle Robbins
Licensed Insurance Agent
Michelle Robbins has been a licensed insurance agent for over 13 years. Her career began in the real estate industry, supporting local realtors with Title Insurance. After several years, Michelle shifted to real estate home warranty insurance, where she managed a territory of over 100 miles of real estate professionals. Later, Agent Robbins obtained more licensing and experience serving families a...
Licensed Insurance Agent
UPDATED: Mar 28, 2024
It’s all about you. We want to help you make the right coverage choices.
Advertiser Disclosure: We strive to help you make confident car insurance decisions. Comparison shopping should be easy. We are not affiliated with any one car insurance provider and cannot guarantee quotes from any single provider.
Our insurance industry partnerships don’t influence our content. Our opinions are our own. To compare quotes from many different companies please enter your ZIP code on this page to use the free quote tool. The more quotes you compare, the more chances to save.
Editorial Guidelines: We are a free online resource for anyone interested in learning more about auto insurance. Our goal is to be an objective, third-party resource for everything auto insurance related. We update our site regularly, and all content is reviewed by auto insurance experts.
The average insurance rates for a Cadillac XTS are $1,282 a year with full coverage. Comprehensive costs an estimated $242 a year, collision insurance costs $418, and liability coverage costs around $464. Buying just liability costs as low as $514 a year, and insurance for high-risk drivers costs around $2,782. Teens cost the most to insure at up to $4,942 a year.
Average premium for full coverage: $1,282
Policy rates broken down by type of insurance:
Full coverage includes $500 policy deductibles, liability limits of 30/60, and includes medical/PIP and uninsured motorist coverage. Prices are averaged for all U.S. states and XTS trim levels.
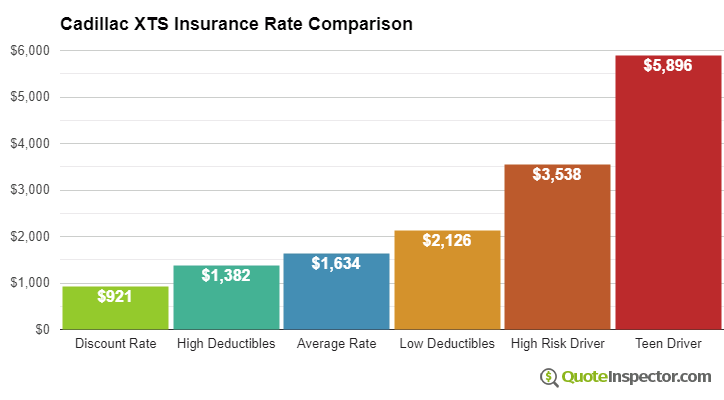
Price Range Variability
Using a middle-aged driver as an example, Cadillac XTS insurance rates range from as low as $514 for liability-only coverage to a high of $2,782 for a driver that may need high-risk insurance.
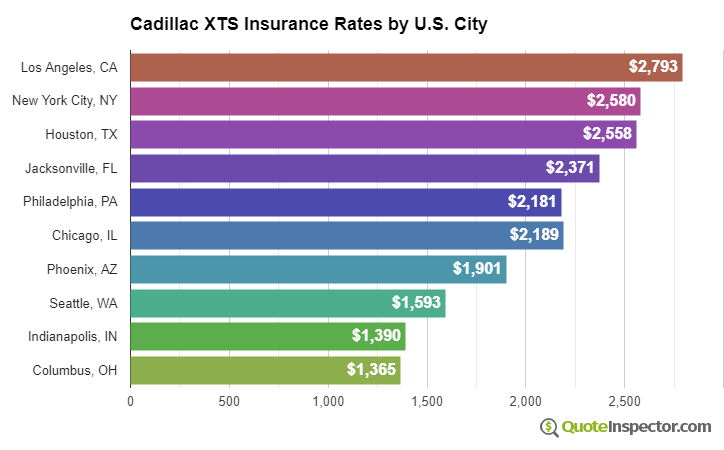
Urban vs. Rural Price Range
Where you live has a large influence on car insurance rates. More rural locations are shown to have a lower frequency of collision claims than cities with more traffic congestion. The diagram below illustrates how where you live affects insurance prices.
The examples above demonstrate why it is important to compare prices for a targeted area and risk profile, rather than using averaged prices.
Use the form below to get customized rates for your location.
Enter your zip code below to view companies based on your location that have cheap auto insurance rates.
Additional Charts and Tables
The chart below details average Cadillac XTS insurance rates for other coverage scenarios.
- The cheapest rate after discounts is $747
- Using higher $1,000 deductibles will save approximately $1,132 annually
- The average rate for a good driver age 40 who has $500 deductibles is $1,282
- Selecting low $100 deductibles for physical damage coverage will increase the cost to $1,572
- Higher-risk drivers with serious driving violations could pay up to $2,782
- Policy cost for full coverage for a teenage driver can cost as much as $4,942 or more
Insurance rates for a Cadillac XTS also range considerably based on your risk profile, the trim level and model year, and liability limits and deductibles.
Older drivers with a clean driving record and high deductibles may only pay around $1,200 a year, or $100 per month, for full coverage. Rates are much higher for teenagers, where even good drivers can expect to pay at least $4,900 a year. View Rates by Age
Your home state has a huge impact on Cadillac XTS insurance rates. A driver around age 40 might see rates as low as $930 a year in states like Utah, Ohio, and New Hampshire, or have to pay at least $1,730 on average in New York, Michigan, and Florida.
| State | Premium | Compared to U.S. Avg | Percent Difference |
|---|---|---|---|
| Alabama | $1,160 | -$122 | -9.5% |
| Alaska | $984 | -$298 | -23.2% |
| Arizona | $1,064 | -$218 | -17.0% |
| Arkansas | $1,282 | -$0 | 0.0% |
| California | $1,462 | $180 | 14.0% |
| Colorado | $1,226 | -$56 | -4.4% |
| Connecticut | $1,320 | $38 | 3.0% |
| Delaware | $1,452 | $170 | 13.3% |
| Florida | $1,604 | $322 | 25.1% |
| Georgia | $1,184 | -$98 | -7.6% |
| Hawaii | $922 | -$360 | -28.1% |
| Idaho | $868 | -$414 | -32.3% |
| Illinois | $956 | -$326 | -25.4% |
| Indiana | $966 | -$316 | -24.6% |
| Iowa | $866 | -$416 | -32.4% |
| Kansas | $1,218 | -$64 | -5.0% |
| Kentucky | $1,750 | $468 | 36.5% |
| Louisiana | $1,898 | $616 | 48.0% |
| Maine | $792 | -$490 | -38.2% |
| Maryland | $1,058 | -$224 | -17.5% |
| Massachusetts | $1,028 | -$254 | -19.8% |
| Michigan | $2,228 | $946 | 73.8% |
| Minnesota | $1,072 | -$210 | -16.4% |
| Mississippi | $1,536 | $254 | 19.8% |
| Missouri | $1,136 | -$146 | -11.4% |
| Montana | $1,378 | $96 | 7.5% |
| Nebraska | $1,012 | -$270 | -21.1% |
| Nevada | $1,536 | $254 | 19.8% |
| New Hampshire | $924 | -$358 | -27.9% |
| New Jersey | $1,432 | $150 | 11.7% |
| New Mexico | $1,136 | -$146 | -11.4% |
| New York | $1,350 | $68 | 5.3% |
| North Carolina | $740 | -$542 | -42.3% |
| North Dakota | $1,050 | -$232 | -18.1% |
| Ohio | $886 | -$396 | -30.9% |
| Oklahoma | $1,316 | $34 | 2.7% |
| Oregon | $1,174 | -$108 | -8.4% |
| Pennsylvania | $1,222 | -$60 | -4.7% |
| Rhode Island | $1,712 | $430 | 33.5% |
| South Carolina | $1,162 | -$120 | -9.4% |
| South Dakota | $1,082 | -$200 | -15.6% |
| Tennessee | $1,124 | -$158 | -12.3% |
| Texas | $1,548 | $266 | 20.7% |
| Utah | $952 | -$330 | -25.7% |
| Vermont | $880 | -$402 | -31.4% |
| Virginia | $768 | -$514 | -40.1% |
| Washington | $990 | -$292 | -22.8% |
| West Virginia | $1,176 | -$106 | -8.3% |
| Wisconsin | $890 | -$392 | -30.6% |
| Wyoming | $1,144 | -$138 | -10.8% |
Choosing higher comprehensive and collision insurance deductibles could cut rates by as much as $440 a year, while buying higher liability limits will increase premiums. Moving from a 50/100 limit to a 250/500 limit will raise rates by up to $417 more per year. View Rates by Deductible or Liability Limit
If you have a few points on your driving record or tend to cause accidents, you may be forking out $1,500 to $2,100 extra every year, depending on your age. A high-risk auto insurance policy can be around 42% to 130% more than the average policy. View High Risk Driver Rates
| Model Year | Comprehensive | Collision | Liability | Total Premium |
|---|---|---|---|---|
| 2020 Cadillac XTS | $292 | $574 | $452 | $1,476 |
| 2019 Cadillac XTS | $280 | $540 | $456 | $1,434 |
| 2018 Cadillac XTS | $268 | $484 | $460 | $1,370 |
| 2017 Cadillac XTS | $250 | $446 | $460 | $1,314 |
| 2016 Cadillac XTS | $242 | $418 | $464 | $1,282 |
| 2015 Cadillac XTS | $236 | $390 | $474 | $1,258 |
| 2014 Cadillac XTS | $218 | $362 | $474 | $1,212 |
| 2013 Cadillac XTS | $212 | $328 | $478 | $1,176 |
Rates are averaged for all Cadillac XTS models and trim levels. Rates assume a 40-year-old male driver, full coverage with $500 deductibles, and a clean driving record.
How to Find More Affordable Cadillac XTS Insurance
Finding cheaper rates on auto insurance requires being a good driver, maintaining good credit, not filing small claims, and deciding if full coverage is necessary. Take the time to comparison shop once a year by quoting rates from direct companies like GEICO, Progressive, and Esurance, and also from local exclusive and independent agents.
The following list is a summary of the data that was touched on in the above illustrations.
- You may be able to save approximately $150 per year just by quoting early and online
- Consumers who want an increased level of liability coverage will pay approximately $510 every year to increase from a 30/60 limit to 250/500 limits
- Drivers age 16 to 20 are charged the highest rates, as much as $412 each month for full coverage
- Drivers who have multiple accidents or major violations may pay on average $1,500 more annually than a safer driver
Rate Tables and Charts
Rates by Driver Age
| Driver Age | Premium |
|---|---|
| 16 | $4,942 |
| 20 | $2,960 |
| 30 | $1,324 |
| 40 | $1,282 |
| 50 | $1,174 |
| 60 | $1,150 |
Full coverage, $500 deductibles
Rates by Deductible
| Deductible | Premium |
|---|---|
| $100 | $1,572 |
| $250 | $1,438 |
| $500 | $1,282 |
| $1,000 | $1,132 |
Full coverage, driver age 40
Rates by Liability Limit
| Liability Limit | Premium |
|---|---|
| 30/60 | $1,282 |
| 50/100 | $1,375 |
| 100/300 | $1,491 |
| 250/500 | $1,792 |
| 100 CSL | $1,421 |
| 300 CSL | $1,676 |
| 500 CSL | $1,862 |
Full coverage, driver age 40
Rates for High Risk Drivers
| Age | Premium |
|---|---|
| 16 | $7,024 |
| 20 | $4,718 |
| 30 | $2,826 |
| 40 | $2,782 |
| 50 | $2,656 |
| 60 | $2,632 |
Full coverage, $500 deductibles, two speeding tickets, and one at-fault accident
If a financial responsibility filing is required, the additional charge below may also apply.
Potential Rate Discounts
If you qualify for discounts, you may save the amounts shown below.
| Discount | Savings |
|---|---|
| Multi-policy | $67 |
| Multi-vehicle | $69 |
| Homeowner | $21 |
| 5-yr Accident Free | $89 |
| 5-yr Claim Free | $83 |
| Paid in Full/EFT | $55 |
| Advance Quote | $61 |
| Online Quote | $90 |
| Total Discounts | $535 |
Discounts are estimated and may not be available from every company or in every state.
Compare Rates and Save
Find companies with the cheapest rates in your area