
Deadliest Cities for Pedestrians in 2026
Enter your zip code below to view companies that have cheap auto insurance rates.
Michelle Robbins
Licensed Insurance Agent
Michelle Robbins has been a licensed insurance agent for over 13 years. Her career began in the real estate industry, supporting local realtors with Title Insurance. After several years, Michelle shifted to real estate home warranty insurance, where she managed a territory of over 100 miles of real estate professionals. Later, Agent Robbins obtained more licensing and experience serving families a...
Licensed Insurance Agent
UPDATED: Jun 12, 2023
It’s all about you. We want to help you make the right coverage choices.
Advertiser Disclosure: We strive to help you make confident car insurance decisions. Comparison shopping should be easy. We are not affiliated with any one car insurance provider and cannot guarantee quotes from any single provider.
Our insurance industry partnerships don’t influence our content. Our opinions are our own. To compare quotes from many different companies please enter your ZIP code on this page to use the free quote tool. The more quotes you compare, the more chances to save.
Editorial Guidelines: We are a free online resource for anyone interested in learning more about auto insurance. Our goal is to be an objective, third-party resource for everything auto insurance related. We update our site regularly, and all content is reviewed by auto insurance experts.
Key Takeaways:
- Pedestrian fatalities increased by more than 27% during our study period
- The rise in pedestrian fatalities coincides with the rise in smartphone usage
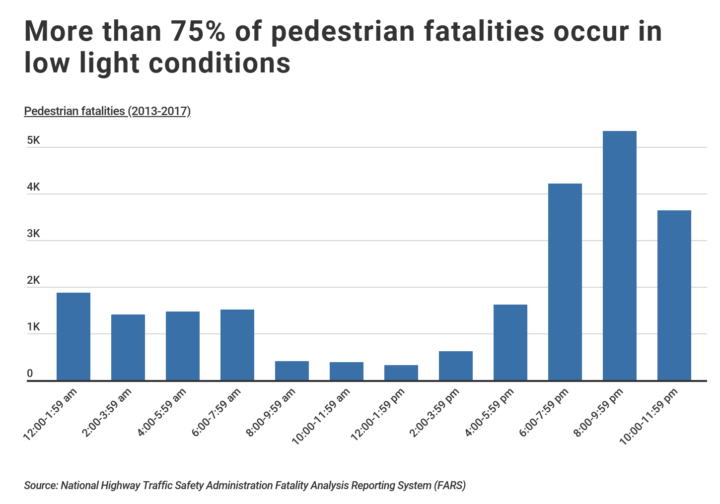
- The vast majority of pedestrian fatalities occur between dusk and dawn
Pedestrian deaths have been climbing since 2009 and are currently at the highest level in decades, according to data from the National Highway Traffic Safety Administration (NHTSA). This has occurred at the same time that the total number of motor vehicle fatalities has been on a continuous downward trend.
This article dives deep into the deadliest cities for pedestrians in the United States. While the total number of miles traveled on American roads increased by 7.5% between 2013 and 2017, the number of pedestrian fatalities during the same period increased by more than 27%. As of 2017, pedestrians accounted for 16.1% of all traffic-related fatalities.
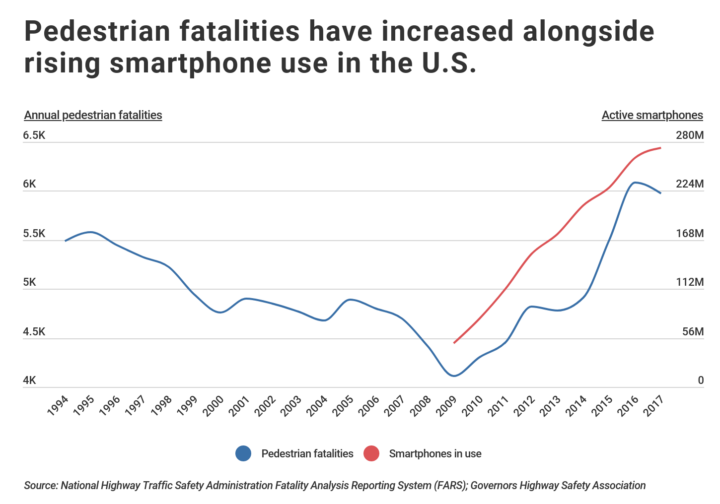
The NHTSA reports that in nearly half of traffic crashes that resulted in a pedestrian fatality, the driver and/or the pedestrian had consumed alcohol before the crash. In addition, a 2018 report from the Governors Highway Safety Administration points to the widespread use of smartphones as a potential explanation for the rise in fatal pedestrian accidents.
Cell phone use quintupled in the period between 2010 and 2017 as pedestrian fatalities also increased significantly. However, there’s insufficient evidence to establish a definitive causal link between the two trends.
Outside of distraction and impairment, a number of factors contribute to the likelihood of pedestrian fatalities, including the time of day. Pedestrian fatalities are nearly 3.5 times more likely to occur during low light conditions.
From 2013 to 2017, there were more than 20,000 pedestrian fatalities that occurred in between dusk and dawn, while only 6,180 occurred during full daylight.
Although many new cars are equipped with safety features like pedestrian-detection technology, a study by AAA found that these features frequently fail at night—underscoring the importance for drivers to be especially vigilant during these hours.
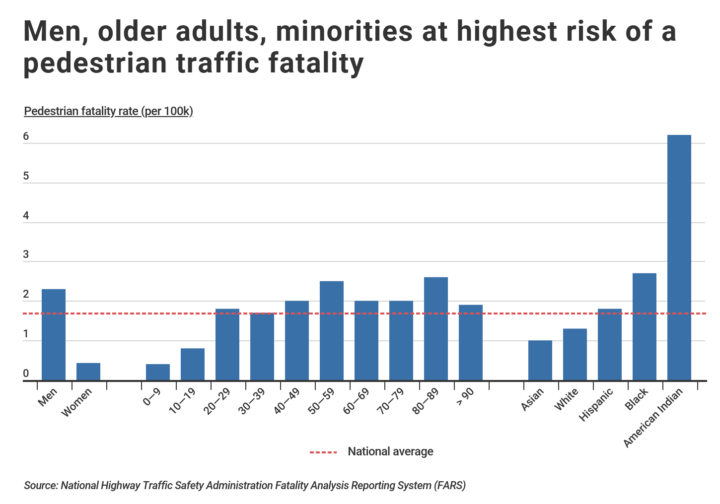
Nationwide, the pedestrian fatality rate in 2017 was 1.7 per 100,000 people; however, certain demographic groups experience significantly higher rates. Adults in the U.S. over age 50 suffer from more pedestrian fatalities than younger Americans. Seniors between 80-89 experience the highest pedestrian fatality rates, while children under 10 experience the lowest rates.
The overall pedestrian fatality rate for men (2.4 per 100,000) is more than double the rate for women (about 1 per 100,000).
Similarly, American Indians and Blacks suffer from much higher pedestrian fatality rates than the national average, at 6.2 per 100,000 and 2.7 per 100,000, respectively. By contrast, Asians and whites are less likely than average to be victims of a fatal accident.
RELATED
No matter how much you drive, the importance of choosing a reliable auto insurer—like State Farm vs Allstate, Geico, or Progressive—can’t be overstated. Our research team has compiled everything you need to know when comparing car insurance.
Like different demographic groups, some parts of the U.S. are more prone to pedestrian fatalities as well. NHTSA data shows that 80% of pedestrian fatalities took place in urban areas, compared to just 20% in rural areas.
To find which of these urban areas are most dangerous for pedestrians, researchers here at QuoteInspector.com analyzed pedestrian fatality statistics from the National Highway Traffic Safety Administration’s Fatality Analysis Reporting System for the period 2013-2017 and demographic data from the U.S. Census Bureau’s American Community Survey.
Across the 200 largest cities in the U.S., the most dangerous cities for pedestrians tend to be located in the South or the West, and 15 of the top 20 cities experienced an increase in pedestrian fatalities over the past five years.
The number of vehicle-related fatalities can affect auto insurance rates for all car owners in an area, even if they aren’t involved directly in an auto-related fatality. Still, there are ways to reduce your auto insurance rates.
One of those ways is to head over to our insurance rates for your vehicle page, which shows how much auto insurance you should be paying for your vehicle and why.
Even if you live in one of the worst cities for pedestrian deaths, you can still find cheap auto insurance quotes by using our FREE online quote comparison tool. Enter your ZIP code to find the best auto insurance quotes in your area based on your information.
In this article, we’ll cover pedestrian fatality rates by city, which US state is the most dangerous for pedestrians, and do it all while using our own pedestrian danger index. Let’s get started.
The 20 Deadliest Cities for Pedestrians
#20 – Dallas, TX
- Pedestrian fatality rate: 3.8 per 100k (2.2X higher than U.S. average)
- Total pedestrian fatalities (past 5 years): 244
- 5-year change in pedestrian fatalities: 36.8%
- Pedestrian fatalities in low light conditions: 82.4%
- 65+ pedestrian fatality rate: 4.2 per 100k
- Minority pedestrian fatality rate: 3.8 per 100k
#19 – Jacksonville, FL
- Pedestrian fatality rate: 3.9 per 100k (2.3X higher than U.S. average)
- Total pedestrian fatalities (past 5 years): 171
- 5-year change in pedestrian fatalities: 15.2%
- Pedestrian fatalities in low light conditions: 86.6%
- 65+ pedestrian fatality rate: 4.7 per 100k
- Minority pedestrian fatality rate: 3.5 per 100k
#18 – Orlando, FL
- Pedestrian fatality rate: 4.0 per 100k (2.4X higher than U.S. average)
- Total pedestrian fatalities (past 5 years): 54
- 5-year change in pedestrian fatalities: 85.7%
- Pedestrian fatalities in low light conditions: 77.8%
- 65+ pedestrian fatality rate: 7.1 per 100k
- Minority pedestrian fatality rate: 3.1 per 100k
DID YOU KNOW?
There are more than 30,000 speeding violations issued every day in the U.S. That’s why we’ve compiled everything you need to know about how a speeding ticket will affect your car insurance.
#17 – Pomona, CA
- Pedestrian fatality rate: 4.2 per 100k (2.5X higher than U.S. average)
- Total pedestrian fatalities (past 5 years): 32
- 5-year change in pedestrian fatalities: 20.0%
- Pedestrian fatalities in low light conditions: 84.4%
- 65+ pedestrian fatality rate: 7.0 per 100k
- Minority pedestrian fatality rate: 3.6 per 100k
#16 – Saint Louis, MO
- Pedestrian fatality rate: 4.2 per 100k (2.5X higher than U.S. average)
- Total pedestrian fatalities (past 5 years): 66
- 5-year change in pedestrian fatalities: No change
- Pedestrian fatalities in low light conditions: 75.8%
- 65+ pedestrian fatality rate: 4.2 per 100k
- Minority pedestrian fatality rate: 4.8 per 100k
Free Auto Insurance Comparison
Enter your zip code below to view companies that have cheap auto insurance rates.


#15 – Miami, FL
- Pedestrian fatality rate: 4.2 per 100k (2.5X higher than U.S. average)
- Total pedestrian fatalities (past 5 years): 92
- 5-year change in pedestrian fatalities: -66.7%
- Pedestrian fatalities in low light conditions: 69.6%
- 65+ pedestrian fatality rate: 9.0 per 100k
- Minority pedestrian fatality rate: 4.1 per 100k
#14 – Atlanta, GA
- Pedestrian fatality rate: 4.2 per 100k (2.5X higher than U.S. average)
- Total pedestrian fatalities (past 5 years): 97
- 5-year change in pedestrian fatalities: 5.0%
- Pedestrian fatalities in low light conditions: 76.3%
- 65+ pedestrian fatality rate: 5.0 per 100k
- Minority pedestrian fatality rate: 4.0 per 100k
#13 – Memphis, TN
- Pedestrian fatality rate: 4.2 per 100k (2.5X higher than U.S. average)
- Total pedestrian fatalities (past 5 years): 138
- 5-year change in pedestrian fatalities: 48.0%
- Pedestrian fatalities in low light conditions: 81.2%
- 65+ pedestrian fatality rate: 5.2 per 100k
- Minority pedestrian fatality rate: 3.6 per 100k
#12 – Tampa, FL
- Pedestrian fatality rate: 4.3 per 100k (2.5X higher than U.S. average)
- Total pedestrian fatalities (past 5 years): 79
- 5-year change in pedestrian fatalities: 100.0%
- Pedestrian fatalities in low light conditions: 81.0%
- 65+ pedestrian fatality rate: 6.2 per 100k
- Minority pedestrian fatality rate: 4.4 per 100k
#11 – Albuquerque, NM
- Pedestrian fatality rate: 4.3 per 100k (2.5X higher than U.S. average)
- Total pedestrian fatalities (past 5 years): 119
- 5-year change in pedestrian fatalities: 81.3%
- Pedestrian fatalities in low light conditions: 84.9%
- 65+ pedestrian fatality rate: 3.3 per 100k
- Minority pedestrian fatality rate: 5.0 per 100k
TRENDING
What vehicle you drive is one of the most important factors when determining car insurance rates. Use our quote tool to find car insurance rates for popular vehicles like the Tesla Model 3, Nissan 350z, or the Ford Mustang.
#10 – Macon, GA
- Pedestrian fatality rate: 4.4 per 100k (2.6X higher than U.S. average)
- Total pedestrian fatalities (past 5 years): 34
- 5-year change in pedestrian fatalities: No change
- Pedestrian fatalities in low light conditions: 76.5%
- 65+ pedestrian fatality rate: 3.6 per 100k
- Minority pedestrian fatality rate: 2.1 per 100k
#9 – Birmingham, AL
- Pedestrian fatality rate: 4.4 per 100k (2.6X higher than U.S. average)
- Total pedestrian fatalities (past 5 years): 47
- 5-year change in pedestrian fatalities: 150.0%
- Pedestrian fatalities in low light conditions: 72.3%
- 65+ pedestrian fatality rate: 1.4 per 100k
- Minority pedestrian fatality rate: 3.8 per 100k
#8 – Charleston, SC
- Pedestrian fatality rate: 4.6 per 100k (2.7X higher than U.S. average)
- Total pedestrian fatalities (past 5 years): 30
- 5-year change in pedestrian fatalities: 100.0%
- Pedestrian fatalities in low light conditions: 96.7%
- 65+ pedestrian fatality rate: 3.3 per 100k
- Minority pedestrian fatality rate: 8.2 per 100k
Free Auto Insurance Comparison
Enter your zip code below to view companies that have cheap auto insurance rates.
#7 – Jackson, MS
- Pedestrian fatality rate: 4.6 per 100k (2.7X higher than U.S. average)
- Total pedestrian fatalities (past 5 years): 39
- 5-year change in pedestrian fatalities: -50.0%
- Pedestrian fatalities in low light conditions: 89.7%
- 65+ pedestrian fatality rate: 2.0 per 100k
- Minority pedestrian fatality rate: 3.5 per 100k
#6 – Baton Rouge, LA
- Pedestrian fatality rate: 4.6 per 100k (2.7X higher than U.S. average)
- Total pedestrian fatalities (past 5 years): 52
- 5-year change in pedestrian fatalities: 20.0%
- Pedestrian fatalities in low light conditions: 82.7%
- 65+ pedestrian fatality rate: 4.1 per 100k
- Minority pedestrian fatality rate: 3.9 per 100k
#5 – Newark, NJ
- Pedestrian fatality rate: 4.6 per 100k (2.7X higher than U.S. average)
- Total pedestrian fatalities (past 5 years): 65
- 5-year change in pedestrian fatalities: 44.4%
- Pedestrian fatalities in low light conditions: 63.1%
- 65+ pedestrian fatality rate: 6.6 per 100k
- Minority pedestrian fatality rate: 3.9 per 100k
#4 – Phoenix, AZ
- Pedestrian fatality rate: 4.6 per 100k (2.7X higher than U.S. average)
- Total pedestrian fatalities (past 5 years): 362
- 5-year change in pedestrian fatalities: 88.5%
- Pedestrian fatalities in low light conditions: 76.8%
- 65+ pedestrian fatality rate: 7.3 per 100k
- Minority pedestrian fatality rate: 4.3 per 100k
#3 – San Bernardino, CA
- Pedestrian fatality rate: 4.9 per 100k (2.9X higher than U.S. average)
- Total pedestrian fatalities (past 5 years): 53
- 5-year change in pedestrian fatalities: 28.6%
- Pedestrian fatalities in low light conditions: 77.4%
- 65+ pedestrian fatality rate: 8.6 per 100k
- Minority pedestrian fatality rate: 3.8 per 100k
Free Auto Insurance Comparison
Enter your zip code below to view companies that have cheap auto insurance rates.
#2 – Detroit, MI
- Pedestrian fatality rate: 5.5 per 100k (3.2X higher than U.S. average)
- Total pedestrian fatalities (past 5 years): 186
- 5-year change in pedestrian fatalities: -33.3%
- Pedestrian fatalities in low light conditions: 83.3%
- 65+ pedestrian fatality rate: 4.3 per 100k
- Minority pedestrian fatality rate: 4.4 per 100k
#1 – Fort Lauderdale, FL
- Pedestrian fatality rate: 6.7 per 100k (3.9X higher than U.S. average)
- Total pedestrian fatalities (past 5 years): 59
- 5-year change in pedestrian fatalities: 9.1%
- Pedestrian fatalities in low light conditions: 83.1%
- 65+ pedestrian fatality rate: 6.1 per 100k
- Minority pedestrian fatality rate: 7.0 per 100k
Full Ranking for All 200 Metros
| City | Rank | Pedestrian Death Rate | Total Pedestrian Deaths | 5-year Change: Pedestrian Deaths | Pedestrian Deaths in Low Light | 65+ Pedestrian Death Rate | Minority Pedestrian Death Rate |
|---|---|---|---|---|---|---|---|
| Fort Lauderdale, FL | 1 | 6.7 | 59 | 9.1% | 83.1% | 6.1 | 7.0 |
| Detroit, MI | 2 | 5.5 | 186 | -33.3% | 83.3% | 4.3 | 4.4 |
| San Bernardino, CA | 3 | 4.9 | 53 | 28.6% | 77.4% | 8.6 | 3.8 |
| Phoenix, AZ | 4 | 4.6 | 362 | 88.5% | 76.8% | 7.3 | 4.3 |
| Newark, NJ | 5 | 4.6 | 65 | 44.4% | 63.1% | 6.6 | 3.9 |
| Baton Rouge, LA | 6 | 4.6 | 52 | 20.0% | 82.7% | 4.1 | 3.9 |
| Jackson, MS | 7 | 4.6 | 39 | -50.0% | 89.7% | 2.0 | 3.5 |
| Charleston, SC | 8 | 4.6 | 30 | 100.0% | 96.7% | 3.3 | 8.2 |
| Birmingham, AL | 9 | 4.4 | 47 | 150.0% | 72.3% | 1.4 | 3.8 |
| Macon, GA | 10 | 4.4 | 34 | 0.0% | 76.5% | 3.6 | 2.1 |
| Albuquerque, NM | 11 | 4.3 | 119 | 81.3% | 84.9% | 3.3 | 5.0 |
| Tampa, FL | 12 | 4.3 | 79 | 100.0% | 81.0% | 6.2 | 4.4 |
| Memphis, TN | 13 | 4.2 | 138 | 48.0% | 81.2% | 5.2 | 3.6 |
| Atlanta, GA | 14 | 4.2 | 97 | 5.0% | 76.3% | 5.0 | 4.0 |
| Miami, FL | 15 | 4.2 | 92 | -66.7% | 69.6% | 9.0 | 4.1 |
| Saint Louis, MO | 16 | 4.2 | 66 | 0.0% | 75.8% | 4.2 | 4.8 |
| Pomona, CA | 17 | 4.2 | 32 | 20.0% | 84.4% | 7.0 | 3.6 |
| Orlando, FL | 18 | 4.0 | 54 | 85.7% | 77.8% | 7.1 | 3.1 |
| Jacksonville, FL | 19 | 3.9 | 171 | 15.2% | 86.6% | 4.7 | 3.5 |
| Dallas, TX | 20 | 3.8 | 244 | 36.8% | 82.4% | 4.2 | 3.8 |
| Saint Petersburg, FL | 21 | 3.8 | 49 | 50.0% | 85.7% | 3.1 | 4.2 |
| Glendale, AZ | 22 | 3.8 | 46 | 22.2% | 84.8% | 5.3 | 3.2 |
| New Orleans, LA | 23 | 3.7 | 71 | -21.4% | 67.6% | 4.0 | 3.3 |
| Bakersfield, CA | 24 | 3.6 | 68 | 133.3% | 75.0% | 6.3 | 3.9 |
| Savannah, GA | 25 | 3.6 | 26 | 20.0% | 84.6% | 4.3 | 2.6 |
| Columbia, SC | 26 | 3.6 | 24 | 100.0% | 79.2% | 9.3 | 5.0 |
| Santa Ana, CA | 27 | 3.5 | 58 | -23.1% | 74.1% | 14.7 | 2.7 |
| San Antonio, TX | 28 | 3.4 | 247 | 7.1% | 84.2% | 5.4 | 3.1 |
| Mobile, AL | 29 | 3.4 | 33 | -14.3% | 93.9% | 3.4 | 2.4 |
| Rockford, IL | 30 | 3.4 | 25 | -72.7% | 88.0% | 3.4 | 2.9 |
| Tulsa, OK | 31 | 3.3 | 67 | 8.3% | 74.6% | 3.3 | 3.5 |
| Shreveport, LA | 32 | 3.3 | 32 | 400.0% | 71.9% | 0.7 | 2.3 |
| Salinas, CA | 33 | 3.3 | 26 | -16.7% | 76.9% | 4.6 | 1.5 |
| Fayetteville, NC | 34 | 3.1 | 33 | 0.0% | 75.8% | 2.5 | 3.4 |
| Augusta, GA | 35 | 3.1 | 31 | 120.0% | 77.4% | 2.4 | 1.9 |
| Lancaster, CA | 36 | 3.1 | 25 | 33.3% | 84.0% | 1.3 | 2.4 |
| Mcallen, TX | 37 | 3.1 | 22 | -57.1% | 72.7% | 8.1 | 2.7 |
| Tucson, AZ | 38 | 3.0 | 80 | 0.0% | 82.5% | 3.0 | 2.9 |
| West Valley City, UT | 39 | 3.0 | 20 | 300.0% | 70.0% | 5.6 | 1.4 |
| Oklahoma City, OK | 40 | 2.9 | 92 | 56.3% | 75.0% | 4.0 | 2.4 |
| Sacramento, CA | 41 | 2.9 | 71 | 33.3% | 87.3% | 4.0 | 2.3 |
| Knoxville, TN | 42 | 2.9 | 27 | 166.7% | 70.4% | 3.3 | 2.7 |
| Houston, TX | 43 | 2.8 | 317 | 69.8% | 75.1% | 4.2 | 2.8 |
| Fort Worth, TX | 44 | 2.8 | 115 | 113.3% | 80.0% | 2.6 | 2.4 |
| Louisville, KY | 45 | 2.8 | 86 | 31.3% | 83.7% | 2.1 | 2.8 |
| Corpus Christi, TX | 46 | 2.8 | 45 | 175.0% | 93.3% | 1.9 | 2.0 |
| Stockton, CA | 47 | 2.8 | 42 | 37.5% | 69.1% | 6.1 | 2.2 |
| Los Angeles, CA | 48 | 2.7 | 527 | 33.3% | 74.4% | 5.5 | 2.4 |
| Indianapolis, IN | 49 | 2.7 | 117 | 35.0% | 80.3% | 3.3 | 3.0 |
| Lubbock, TX | 50 | 2.7 | 33 | 300.0% | 84.9% | 1.4 | 3.9 |
| Reno, NV | 51 | 2.7 | 32 | 125.0% | 90.6% | 2.4 | 2.3 |
| Dayton, OH | 52 | 2.7 | 19 | 75.0% | 89.5% | 0.0 | 3.6 |
| Austin, TX | 53 | 2.6 | 118 | 9.5% | 81.4% | 3.1 | 2.7 |
| Worcester, MA | 54 | 2.6 | 24 | 0.0% | 79.2% | 7.6 | 0.3 |
| Fresno, CA | 55 | 2.5 | 66 | 109.1% | 86.4% | 5.9 | 2.1 |
| Greensboro, NC | 56 | 2.5 | 36 | 180.0% | 69.4% | 0.5 | 2.8 |
| San Diego, CA | 57 | 2.4 | 164 | 3.3% | 76.8% | 3.6 | 2.1 |
| Milwaukee, WI | 58 | 2.4 | 71 | 200.0% | 64.8% | 3.7 | 2.4 |
| Anchorage, AK | 59 | 2.4 | 36 | 20.0% | 72.2% | 2.8 | 4.1 |
| Norfolk, VA | 60 | 2.4 | 30 | -37.5% | 83.3% | 6.3 | 2.3 |
| Salt Lake City, UT | 61 | 2.4 | 23 | 0.0% | 87.0% | 6.8 | 3.6 |
| Garden Grove, CA | 62 | 2.4 | 21 | 700.0% | 76.2% | 4.3 | 1.9 |
| Palmdale, CA | 63 | 2.4 | 19 | 0.0% | 84.2% | 7.6 | 2.1 |
| Philadelphia, PA | 64 | 2.3 | 180 | 2.8% | 65.0% | 4.6 | 0.5 |
| El Paso, TX | 65 | 2.3 | 78 | 33.3% | 74.4% | 5.1 | 2.2 |
| Nashville, TN | 66 | 2.3 | 76 | 118.2% | 81.6% | 3.0 | 2.3 |
| Baltimore, MD | 67 | 2.3 | 72 | -6.7% | 56.9% | 3.3 | 1.9 |
| Oakland, CA | 68 | 2.3 | 47 | -30.0% | 61.7% | 5.7 | 2.0 |
| Honolulu, HI | 69 | 2.3 | 41 | -50.0% | 63.4% | 6.2 | 2.2 |
| Montgomery, AL | 70 | 2.3 | 23 | 100.0% | 87.0% | 0.0 | 2.5 |
| Little Rock, AR | 71 | 2.3 | 23 | 100.0% | 91.3% | 2.3 | 1.7 |
| Santa Rosa, CA | 72 | 2.3 | 20 | 33.3% | 60.0% | 4.4 | 0.3 |
| Hollywood, FL | 73 | 2.3 | 17 | -25.0% | 76.5% | 4.0 | 0.9 |
| Bridgeport, CT | 74 | 2.3 | 17 | 500.0% | 58.8% | 7.6 | 1.7 |
| San Francisco, CA | 75 | 2.2 | 94 | -21.1% | 54.3% | 6.1 | 1.9 |
| Richmond, VA | 76 | 2.2 | 24 | 450.0% | 62.5% | 3.0 | 1.5 |
| Huntington Beach, CA | 77 | 2.2 | 22 | -20.0% | 72.7% | 4.1 | 0.8 |
| Tempe, AZ | 78 | 2.2 | 20 | 300.0% | 75.0% | 4.6 | 2.4 |
| Oceanside, CA | 79 | 2.2 | 19 | 150.0% | 79.0% | 1.5 | 1.5 |
| Springfield, MA | 80 | 2.2 | 17 | -33.3% | 58.8% | 2.2 | 2.5 |
| Charlotte, NC | 81 | 2.1 | 85 | 145.5% | 77.7% | 1.5 | 2.4 |
| Denver, CO | 82 | 2.1 | 72 | -7.1% | 84.7% | 3.2 | 2.4 |
| Winston Salem, NC | 83 | 2.1 | 25 | 0.0% | 60.0% | 1.8 | 2.3 |
| Modesto, CA | 84 | 2.1 | 22 | 200.0% | 90.9% | 3.5 | 0.5 |
| Amarillo, TX | 85 | 2.1 | 21 | 200.0% | 66.7% | 1.6 | 2.3 |
| Huntsville, AL | 86 | 2.1 | 20 | 33.3% | 90.0% | 2.1 | 2.8 |
| Newport News, VA | 87 | 2.1 | 19 | 50.0% | 79.0% | 2.8 | 2.4 |
| Salem, OR | 88 | 2.1 | 17 | 50.0% | 82.4% | 3.7 | 1.1 |
| Waco, TX | 89 | 2.1 | 14 | 500.0% | 78.6% | 5.2 | 2.4 |
| San Jose, CA | 90 | 2.0 | 100 | -40.9% | 73.0% | 4.8 | 1.4 |
| Las Vegas, NV | 91 | 2.0 | 62 | 100.0% | 75.8% | 3.4 | 1.9 |
| Long Beach, CA | 92 | 2.0 | 48 | 33.3% | 68.8% | 5.2 | 1.4 |
| North Las Vegas, NV | 93 | 2.0 | 23 | 100.0% | 69.6% | 6.2 | 1.9 |
| Providence, RI | 94 | 2.0 | 18 | -40.0% | 50.0% | 8.1 | 1.0 |
| Chattanooga, TN | 95 | 2.0 | 18 | -60.0% | 72.2% | 1.5 | 0.8 |
| Hayward, CA | 96 | 2.0 | 16 | 33.3% | 68.8% | 2.3 | 1.1 |
| Portland, OR | 97 | 1.9 | 61 | 72.7% | 72.1% | 2.4 | 2.2 |
| Anaheim, CA | 98 | 1.9 | 33 | 25.0% | 66.7% | 4.2 | 1.4 |
| Toledo, OH | 99 | 1.9 | 27 | 133.3% | 70.4% | 2.1 | 2.7 |
| Garland, TX | 100 | 1.9 | 23 | 150.0% | 91.3% | 1.5 | 1.5 |
| Rochester, NY | 101 | 1.9 | 20 | -33.3% | 80.0% | 1.9 | 1.1 |
| Tacoma, WA | 102 | 1.9 | 20 | 200.0% | 70.0% | 2.2 | 2.7 |
| Glendale, CA | 103 | 1.9 | 19 | -50.0% | 63.2% | 7.9 | 0.5 |
| Ontario, CA | 104 | 1.9 | 16 | 0.0% | 87.5% | 4.1 | 1.5 |
| Springfield, MO | 105 | 1.9 | 16 | 500.0% | 75.0% | 2.4 | 0.8 |
| Torrance, CA | 106 | 1.9 | 14 | 50.0% | 85.7% | 3.3 | 2.0 |
| Syracuse, NY | 107 | 1.9 | 14 | 250.0% | 57.1% | 2.3 | 1.4 |
| Raleigh, NC | 108 | 1.8 | 40 | 12.5% | 82.5% | 1.4 | 2.2 |
| Hialeah, FL | 109 | 1.8 | 21 | 166.7% | 47.6% | 5.0 | 1.6 |
| Fontana, CA | 110 | 1.8 | 19 | 125.0% | 73.7% | 4.0 | 1.5 |
| Tallahassee, FL | 111 | 1.8 | 17 | 0.0% | 82.4% | 0.0 | 1.8 |
| Clarksville, TN | 112 | 1.8 | 13 | -66.7% | 76.9% | 3.4 | 1.0 |
| Warren, MI | 113 | 1.8 | 12 | N/A | 66.7% | 3.8 | 2.4 |
| Mesa, AZ | 114 | 1.7 | 40 | 114.3% | 82.5% | 2.9 | 1.3 |
| Cleveland, OH | 115 | 1.7 | 34 | 140.0% | 76.5% | 1.5 | 1.9 |
| Cincinnati, OH | 116 | 1.7 | 26 | 100.0% | 50.0% | 5.6 | 1.4 |
| Fort Wayne, IN | 117 | 1.7 | 22 | -33.3% | 72.7% | 1.7 | 1.0 |
| Laredo, TX | 118 | 1.7 | 22 | 0.0% | 63.6% | 5.3 | 1.7 |
| Moreno Valley, CA | 119 | 1.7 | 17 | 300.0% | 88.2% | 3.7 | 1.5 |
| Escondido, CA | 120 | 1.7 | 13 | 200.0% | 53.9% | 1.2 | 1.5 |
| Mesquite, TX | 121 | 1.7 | 12 | N/A | 83.3% | 1.4 | 1.4 |
| Killeen, TX | 122 | 1.7 | 12 | 400.0% | 91.7% | 2.4 | 1.4 |
| New York, NY | 123 | 1.6 | 668 | -46.9% | 59.3% | 4.4 | 1.4 |
| Arlington, TX | 124 | 1.6 | 32 | 20.0% | 84.4% | 1.0 | 1.4 |
| Riverside, CA | 125 | 1.6 | 25 | 60.0% | 56.0% | 1.9 | 1.4 |
| Pittsburgh, PA | 126 | 1.6 | 24 | 0.0% | 66.7% | 3.7 | 0.2 |
| Durham, NC | 127 | 1.6 | 20 | -20.0% | 85.0% | 2.2 | 1.8 |
| Scottsdale, AZ | 128 | 1.6 | 19 | N/A | 89.5% | 1.8 | 2.6 |
| Des Moines, IA | 129 | 1.6 | 17 | 50.0% | 64.7% | 0.8 | 1.1 |
| Brownsville, TX | 130 | 1.6 | 15 | 25.0% | 60.0% | 2.9 | 1.5 |
| Vancouver, WA | 131 | 1.6 | 14 | 300.0% | 92.9% | 1.6 | 3.0 |
| Lakewood, CO | 132 | 1.6 | 12 | 200.0% | 75.0% | 3.3 | 2.6 |
| Washington, DC | 133 | 1.5 | 50 | 22.2% | 64.0% | 3.0 | 1.8 |
| Boston, MA | 134 | 1.5 | 50 | 37.5% | 60.0% | 4.6 | 1.7 |
| Columbus, GA | 135 | 1.5 | 15 | 300.0% | 86.7% | 0.8 | 1.2 |
| Sunnyvale, CA | 136 | 1.5 | 11 | 200.0% | 54.6% | 4.4 | 1.2 |
| Midland, TX | 137 | 1.5 | 10 | 200.0% | 70.0% | 1.4 | 1.4 |
| New Haven, CT | 138 | 1.5 | 10 | 0.0% | 80.0% | 0.0 | 0.7 |
| Chicago, IL | 139 | 1.4 | 189 | 51.9% | 52.9% | 2.8 | 1.4 |
| Columbus, OH | 140 | 1.4 | 60 | 114.3% | 80.0% | 0.5 | 1.4 |
| Jersey City, NJ | 141 | 1.4 | 18 | 300.0% | 66.7% | 3.0 | 1.2 |
| Chula Vista, CA | 142 | 1.4 | 18 | 100.0% | 88.9% | 1.3 | 0.8 |
| Fremont, CA | 143 | 1.4 | 16 | 0.0% | 75.0% | 5.1 | 1.3 |
| Spokane, WA | 144 | 1.4 | 15 | 600.0% | 66.7% | 1.9 | 2.0 |
| Grand Rapids, MI | 145 | 1.4 | 14 | 400.0% | 71.4% | 2.7 | 2.0 |
| Pembroke Pines, FL | 146 | 1.4 | 12 | 0.0% | 50.0% | 1.5 | 1.6 |
| Pasadena, CA | 147 | 1.4 | 10 | -50.0% | 60.0% | 1.8 | 1.1 |
| Orange, CA | 148 | 1.4 | 10 | -100.0% | 70.0% | 4.9 | 1.0 |
| Wichita, KS | 149 | 1.3 | 25 | 40.0% | 56.0% | 3.1 | 1.4 |
| Aurora, CO | 150 | 1.3 | 24 | 200.0% | 91.7% | 1.1 | 1.5 |
| Henderson, NV | 151 | 1.3 | 18 | 50.0% | 83.3% | 2.6 | 1.1 |
| Buffalo, NY | 152 | 1.3 | 17 | 66.7% | 70.6% | 1.3 | 1.0 |
| Madison, WI | 153 | 1.3 | 16 | 50.0% | 50.0% | 5.1 | 0.9 |
| Hampton, VA | 154 | 1.3 | 9 | -50.0% | 100.0% | 2.1 | 1.0 |
| Seattle, WA | 155 | 1.2 | 41 | 9.1% | 41.5% | 3.9 | 1.6 |
| Colorado Springs, CO | 156 | 1.2 | 26 | 233.3% | 76.9% | 1.4 | 0.9 |
| Minneapolis, MN | 157 | 1.2 | 24 | 0.0% | 62.5% | 3.7 | 1.3 |
| Boise, ID | 158 | 1.2 | 13 | 33.3% | 84.6% | 1.4 | 0.5 |
| Santa Clarita, CA | 159 | 1.2 | 13 | -100.0% | 92.3% | 1.7 | 1.1 |
| Akron, OH | 160 | 1.2 | 12 | 200.0% | 66.7% | 0.7 | 1.0 |
| Kansas City, KS | 161 | 1.2 | 9 | 0.0% | 77.8% | 0.0 | 1.3 |
| Paterson, NJ | 162 | 1.2 | 9 | 200.0% | 66.7% | 1.3 | 0.9 |
| Miramar, FL | 163 | 1.2 | 8 | -50.0% | 62.5% | 1.5 | 1.0 |
| Sterling Heights, MI | 164 | 1.2 | 8 | N/A | 87.5% | 0.9 | 1.7 |
| Carrollton, TX | 165 | 1.2 | 8 | 50.0% | 87.5% | 0.0 | 1.8 |
| Denton, TX | 166 | 1.2 | 8 | N/A | 87.5% | 0.0 | 1.9 |
| Omaha, NE | 167 | 1.1 | 26 | 75.0% | 73.1% | 1.1 | 1.2 |
| Rancho Cucamonga, CA | 168 | 1.1 | 10 | -33.3% | 80.0% | 5.5 | 1.1 |
| Joliet, IL | 169 | 1.1 | 8 | N/A | 75.0% | 1.4 | 1.1 |
| Fullerton, CA | 170 | 1.1 | 8 | -100.0% | 62.5% | 3.4 | 0.9 |
| Irving, TX | 171 | 1.0 | 12 | -50.0% | 100.0% | 0.0 | 1.1 |
| Aurora, IL | 172 | 1.0 | 10 | -33.3% | 80.0% | 3.6 | 0.5 |
| Metairie, LA | 173 | 1.0 | 7 | -50.0% | 42.9% | 1.5 | 1.4 |
| Saint Paul, MN | 174 | 0.9 | 14 | 50.0% | 57.1% | 2.0 | 1.0 |
| Oxnard, CA | 175 | 0.9 | 9 | -100.0% | 66.7% | 5.1 | 0.6 |
| Alexandria, VA | 176 | 0.9 | 7 | 0.0% | 42.9% | 3.7 | 0.5 |
| Pasadena, TX | 177 | 0.9 | 7 | N/A | 71.4% | 1.4 | 0.9 |
| Thornton, CO | 178 | 0.9 | 6 | 100.0% | 66.7% | 0.0 | 0.7 |
| Chesapeake, VA | 179 | 0.8 | 10 | 100.0% | 100.0% | 0.0 | 1.2 |
| Yonkers, NY | 180 | 0.8 | 8 | -100.0% | 62.5% | 1.2 | 0.3 |
| Grand Prairie, TX | 181 | 0.8 | 8 | 50.0% | 75.0% | 0.0 | 0.8 |
| Fort Collins, CO | 182 | 0.8 | 6 | N/A | 83.3% | 1.2 | 0.0 |
| Virginia Beach, VA | 183 | 0.7 | 16 | 300.0% | 75.0% | 1.7 | 0.6 |
| Chandler, AZ | 184 | 0.7 | 9 | -50.0% | 88.9% | 0.8 | 0.8 |
| Sioux Falls, SD | 185 | 0.7 | 6 | 100.0% | 66.7% | 0.0 | 0.7 |
| Eugene, OR | 186 | 0.7 | 6 | -100.0% | 66.7% | 1.6 | 0.0 |
| Peoria, AZ | 187 | 0.7 | 6 | -100.0% | 100.0% | 0.8 | 1.7 |
| Bellevue, WA | 188 | 0.7 | 5 | -100.0% | 40.0% | 2.0 | 1.5 |
| Mckinney, TX | 189 | 0.6 | 5 | -100.0% | 60.0% | 1.3 | 0.6 |
| Corona, CA | 190 | 0.6 | 5 | 100.0% | 80.0% | 2.5 | 0.4 |
| Olathe, KS | 191 | 0.6 | 4 | N/A | 50.0% | 1.5 | 0.6 |
| Overland Park, KS | 192 | 0.5 | 5 | 0.0% | 100.0% | 0.7 | 0.0 |
| Cape Coral, FL | 193 | 0.5 | 4 | -100.0% | 75.0% | 0.0 | 0.0 |
| Elk Grove, CA | 194 | 0.5 | 4 | 0.0% | 100.0% | 1.1 | 0.6 |
| Cary, NC | 195 | 0.5 | 4 | 0.0% | 100.0% | 1.1 | 0.7 |
| Naperville, IL | 196 | 0.5 | 4 | N/A | 75.0% | 0.0 | 0.4 |
| Plano, TX | 197 | 0.4 | 5 | -50.0% | 60.0% | 0.6 | 0.3 |
| Lincoln, NE | 198 | 0.4 | 5 | -50.0% | 100.0% | 0.6 | 0.0 |
| Gilbert, AZ | 199 | 0.3 | 3 | 0.0% | 0.0% | 1.0 | 0.3 |
| Springfield, MA | 200 | 0.1 | 1 | N/A | 0.0% | 0.0 | 0.0 |
Methodology: Determining the 20 Deadliest Cities for Pedestrians
Pedestrian fatality statistics are from the National Highway Traffic Safety Administration’s Fatality Analysis Reporting System, for the period 2013-2017. Population statistics, including total city population, racial composition, age distribution, and median household income are from the U.S. Census Bureau’s American Community Survey.
Pedestrian fatality rates were calculated as the average number of pedestrian fatalities in the city for the period 2013-2017 per 100,000 residents. The percent change in the number of fatalities was also calculated between 2013 and 2017. The fatality rates for minorities were calculated for all individuals who do not identify as non-Hispanic white.
Only the top 200 most populous cities in the U.S. were included in the analysis. Cities were ranked according to their overall pedestrian fatality rate. In the event of a tie, cities with a greater number of total pedestrian fatalities were considered more dangerous.
Hitting a pedestrian — like any other accident — can raise auto insurance rates. Find your best auto insurance rate by entering your ZIP code into our FREE online quote generator.
References:
Frequently Asked Questions
Why are these cities considered the deadliest for pedestrians?
Several factors contribute to the higher rates of pedestrian fatalities in these cities. Some of the common factors include:
- High population density: Cities with larger populations tend to have more pedestrian activities, increasing the likelihood of accidents.
- Heavy traffic: Urban areas often experience heavy traffic congestion, which can lead to more interactions between vehicles and pedestrians.
- Infrastructure challenges: Older cities may have outdated or insufficient infrastructure for pedestrian safety, such as lacking sidewalks or pedestrian-friendly crosswalks.
- Driver behavior: Factors like distracted driving, speeding, and failure to yield to pedestrians can contribute to accidents in these cities.
- Pedestrian behavior: Pedestrians themselves may contribute to the risk by engaging in unsafe behaviors like jaywalking or crossing streets while distracted.
Are there any measures being taken to improve pedestrian safety in these cities?
Yes, many cities are actively taking measures to improve pedestrian safety. Some of the initiatives include:
- Infrastructure improvements: Implementing traffic calming measures, building more sidewalks, installing pedestrian-friendly crosswalks, and adding pedestrian islands or refuge areas.
- Enhanced enforcement: Increasing law enforcement efforts to target unsafe driving behaviors and enforce traffic laws related to pedestrian safety.
- Education campaigns: Raising awareness among both drivers and pedestrians about the importance of safety and sharing the road responsibly.
- Urban planning: Incorporating pedestrian-friendly design principles in urban planning, such as mixed-use zoning, reducing vehicle speeds, and improving public transportation options.
- Technology solutions: Implementing innovative technologies like intelligent crosswalks, pedestrian detection systems in vehicles, and traffic signal optimization to enhance pedestrian safety.
Are there insurance implications for pedestrians in these cities?
Pedestrians involved in accidents in these cities may need to file insurance claims to seek compensation for their injuries or damages. Insurance coverage will depend on various factors, including the type of insurance held by the responsible party (such as auto insurance), the circumstances of the accident, and the specific policy terms and coverage limits.
How is pedestrian fatality rate calculated for cities?
Pedestrian fatality rates for cities are typically calculated by dividing the number of pedestrian fatalities by the population or the number of pedestrians in the city. This helps to provide a standardized measure of pedestrian safety by accounting for differences in population size or pedestrian activity.
Are there any specific demographics that are more vulnerable to pedestrian accidents?
Pedestrian accidents can affect individuals of any age or demographic group. However, certain populations may be more vulnerable, including children, older adults, and individuals with disabilities. Children may lack the ability to accurately judge traffic and make safe decisions, while older adults and individuals with disabilities may face mobility challenges that increase their risk.
Frequently Asked Questions
- What is a named operator policy?
- Will Geico insure a car not in my name?
- What Is Covered in a Jeep Powertrain Warranty? 2026
- Cheapest Jeep Insurance Rates in 2026
- Do trucks cost more to insure?
- How long does a DUI stay on your record?
- Does the Porsche Club of America offer car insurance?
- View All Coverage Questions
Popular Rate Quotes
- Honda Civic Insurance
- Honda CR-V Insurance
- Toyota Rav4 Insurance
- Toyota Camry Insurance
- Toyota Corolla Insurance
- Hyundai Santa Fe Insurance
- Ford F-150 Insurance
- GMC Sierra Insurance
- Nissan Rogue Insurance
Compare Rates and Save
Find companies with the cheapest rates in your area

